
Nowadays, web analytics platforms allow digital marketers to easily track all kinds of data around user behavior and browsing patterns to generate relevant insights. However, knowing which metrics to track and measure can be challenging and overwhelming. This task gets increasingly difficult as your website or mobile app scales over time and caters to various users and social media platforms.
To help simplify this process, I’ve narrowed down six essential marketing metrics that will provide you with strategic values and measure the effectiveness of your organic and paid digital marketing efforts.
But before we jump into the metrics, it’s crucial to ask yourself the following three questions:
- What are the main objectives of your business?
- What aspects of your website/app are critical for your company’s short and long-term growth?
- What user actions are the primary drivers for the success of your company?
Now that you have this information about your business let’s dive in.
1. Conversions
To measure user behaviors that are important to your business, you can start defining macro and micro conversions that align with your business objectives.
Macro conversions are the primary conversions on your website, such as purchase completion, lead form submission, and click-to-phone calls. In comparison, micro conversions are good indicators to demonstrate users’ interest in your company’s products and services, such as signing up for newsletters, reading blog posts, and downloading whitepapers.
A set of micro conversions can potentially accumulate and lead to relatively higher-valued macro conversions. For instance, a user who subscribed to a newsletter, a micro conversion, could click on a product link, browse further on your site/mobile app, and place an order, resulting in a macro conversion.
How to Track Conversions
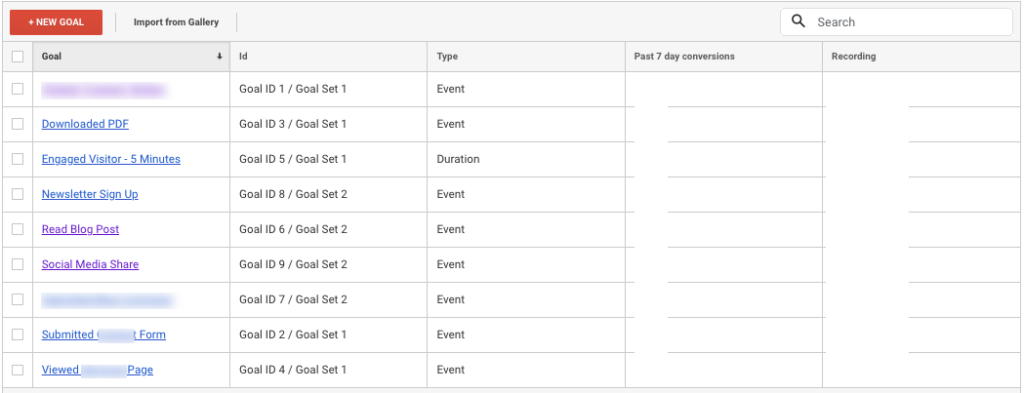
To measure your chosen conversions, you can set up goals on Google Analytics and Google Tag Manager to track destination, duration, event goals, etc.
Below is a screenshot of goals on Google Analytics.
2. Spend
In today’s competitive marketing landscape, it is inevitable that companies spend thousands of dollars each month to attain the targeted traffic and conversions. Tracking where to spend and how much on marketing campaigns not only allows you to plan your marketing budget and strategy but also to know the effectiveness of your paid search and paid social campaigns.
Quarterly and monthly total costs are not sufficient to tell you whether your money is well spent. You also need to look at the cost per click and cost of conversion of each paid campaign to make comparisons. You can adjust your marketing budget accordingly based on the paid campaign performance and the target audience.
How to Track Spend
To build a marketing budget report, I recommend using Google Data Studio and blending several data sources into one to show the marketing budget for each social platform.
In the screenshot below, I have data sources from major social platforms, and I blended these data sources by using the date dimension as the join key.
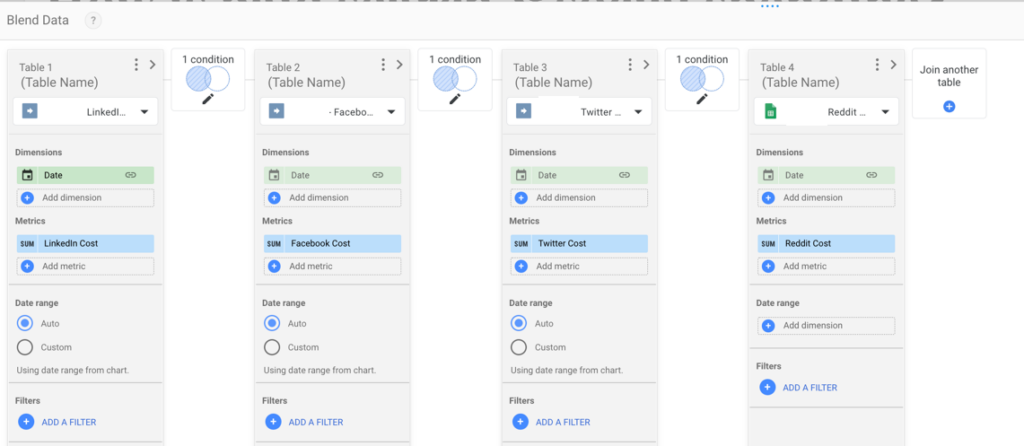
Since Google Data Studio allows data blending for up to five data sources, I am able to show the monthly budgets of different social platforms side by side for comparison in the dashboard below.
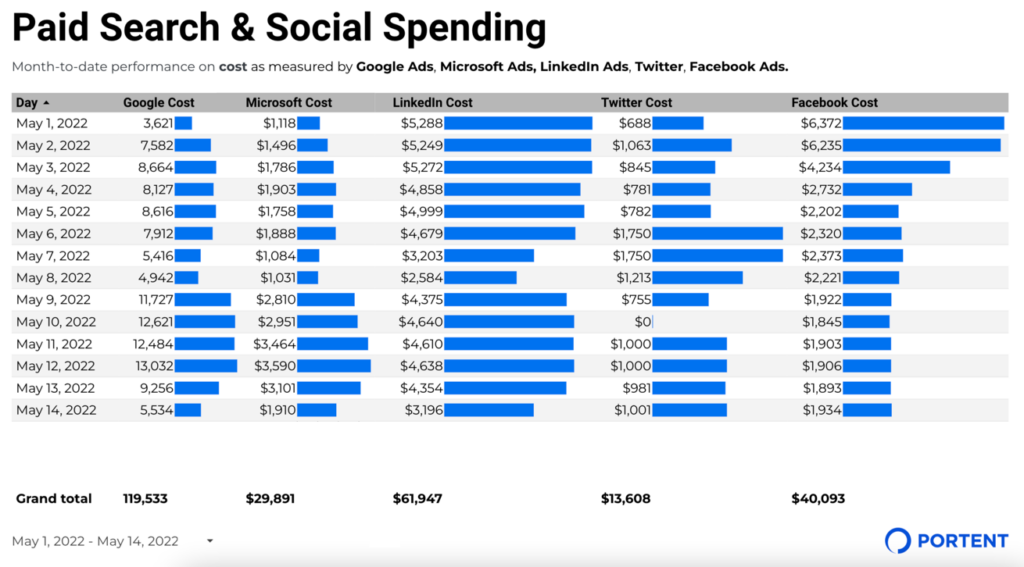
If you get stuck trying to blend data sources, check out our post on troubleshooting data blends on Google Data Studio.
3. User Engagement
Pages per session and session duration are two metrics that provide a concise view of the broad spectrum of user activity and purchase patterns that occur on your site/app.
- Pages per session: as users find more relevant content on your site, you might notice that the number of pages browsed in a single session is relatively high. Consider the pages per session metric for the recent few months as a baseline and as your team incorporates relevant content, blogs, and media on your site, keep track of this metric and how it correlates to the overall conversion rate.
- Session duration: social media sites are a prime example of illustrating session duration. Youtube, for instance, strives in various ways to keep users engaged with features including related videos, personalized feed, recommendations, etc.
Applying the same principle to your site/app, consider incorporating the content of various styles and form factors (video, blog posts, landing pages, content guides, etc.) to provide various ways of conveying value pertaining to a product or service.
It is a good idea to establish the current baseline for average session duration and work towards improving user engagement with relevant media and content. Assess session duration as a key metric periodically and analyze how it ties into the overall success of your offerings.
You may be wondering why I didn’t include Bounce Rate. That’s because it is being replaced in Google Analytics 4 with Engagement Rate.
Engagement rate is the percentage of engaged sessions (Engaged sessions divided by Sessions). According to Google Analytics 4, “the number of sessions that lasted 10 seconds or longer, or had 1 or more conversion events or 2 or more page or screen views” is considered “engaged sessions.” This new metric can show you how users interact and how long they stay on your site/app as opposed to how they exist.
How to Track User Engagement
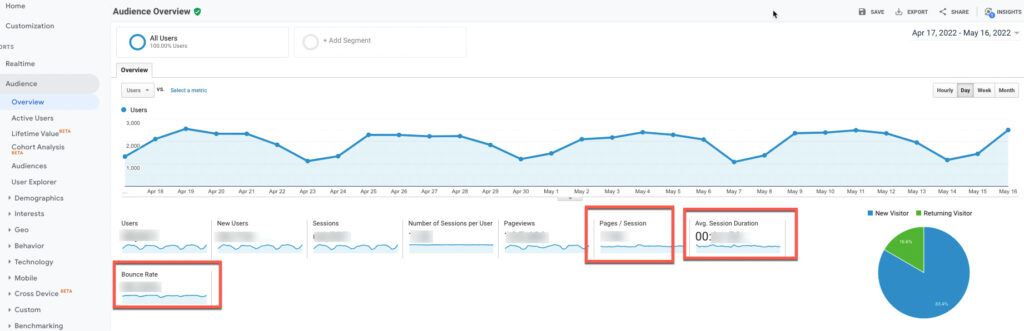
I recommend using Google Analytics Audience Overview report to track and analyze user engagement. Tools like Crazy Egg and Hotjar are often used to track users’ clicks and behavior on your site.
Below is a screenshot of the Audience Overview report on Google Analytics.
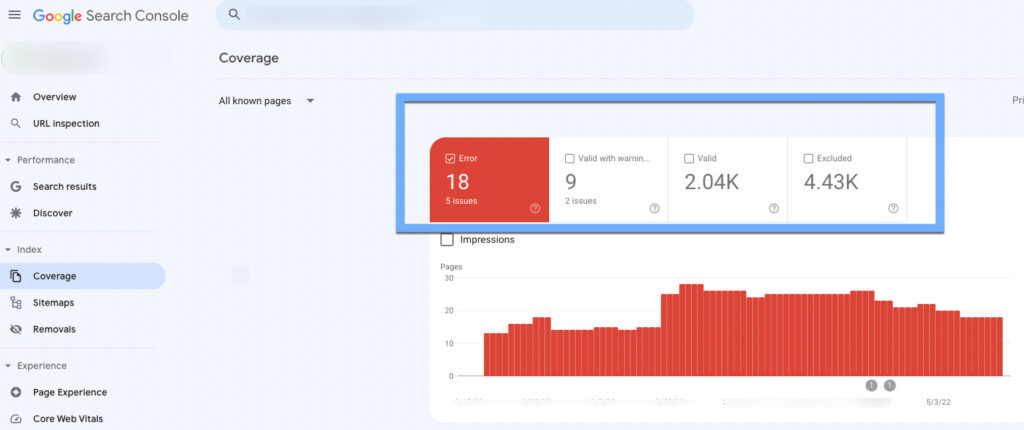
4. Errors
When you make changes to your website like migrating content from one CMS (content management system) to another, upgrading website technology, conducting server maintenance, etc., it’s possible to encounter web page errors such as:
- 404: page not found
- 503: service unavailable
- 401: authorized
- 403: access denied
Such site errors might leave your users confused and result in users most likely exiting the site, not to mention leaving a bad impression of the service quality.
How to Track Errors
Free tools such as Google Search Console and Google Analytics provide a convenient way to track any errors on your site in near real-time. Keeping a close eye on such errors and incorporating the process of fixing such errors into your day-to-day content administration workflow can help keep the overall error rate at a minimum and provide consistent value for your users.
Below is a screenshot of what the Index Coverage report from Google Search Console looks like.
5. Onsite Search Terms
These days, it’s a common practice to incorporate a search feature for any enterprise-level product or service. This feature allows your audience to find exactly what they are looking for instead of navigating through a hierarchical menu.
Once your site/app has such a search feature in place, it is relatively easy to implement onsite search tracking and review the top search terms being entered by your users.
Creating content around such search terms can both add tremendous value to your customers and increase conversions for your products. With relevant content strategically made available to your users, you may also notice a relative drop in the overall time for conversion.
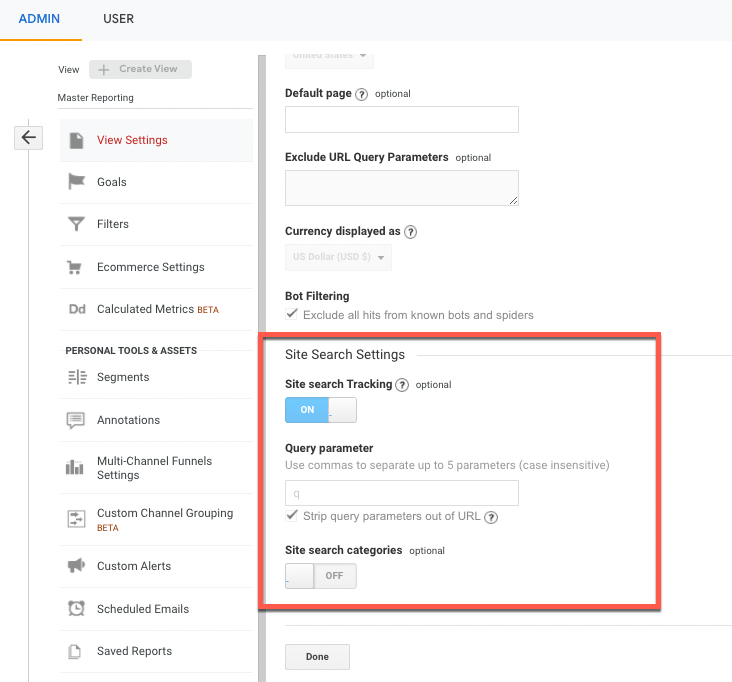
How to Track Onsite Search Terms
To track site search, you can turn on site search tracking on Google Analytics under the View Settings.
6. Site Speed
A few years ago, a website that loads fast may have been a nicety, but these days it’s a necessity. It is common for users to abandon a site and seek out alternatives when site speed is relatively slow.
Having baseline benchmarks for site speed and improving upon such metrics not only makes your content accessible to users at speed but also plays a key role in improving your content’s organic ranking in Google’s search results.
A few metrics to take into account with respect to site speed:
- Page interaction time: This measures how quickly users are able to interact with a webpage while any background content, media, and scripts may still be loading.
- Page load time: This is the average time it takes to load a web page. This metric is based on the samples collected via google analytics and other tracking tools.
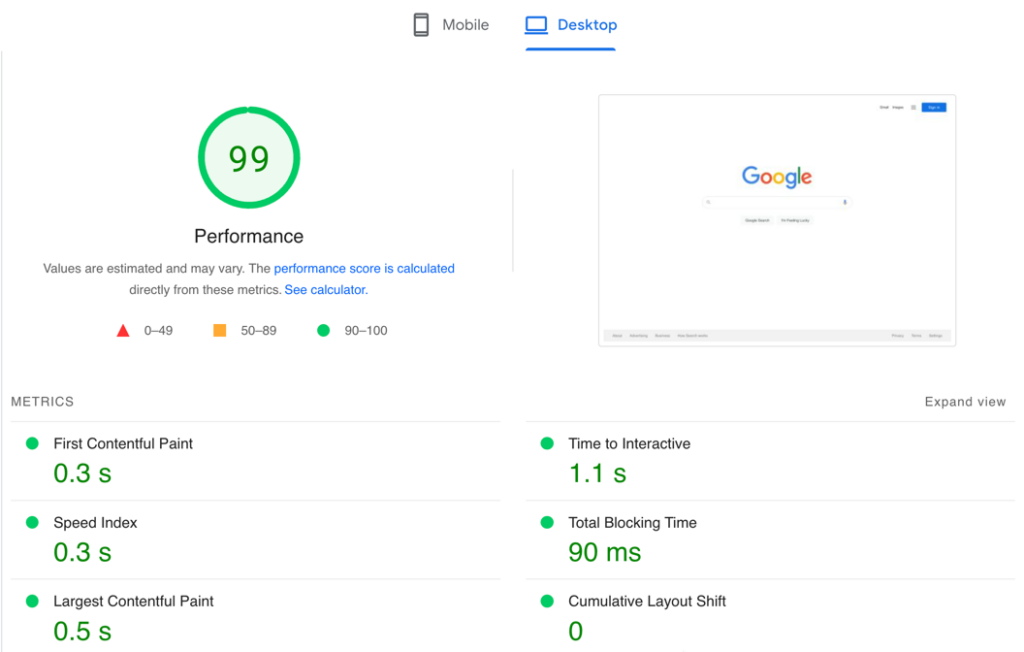
How to Track Site Speed
There are multiple tools available online, such as PageSpeed Insights and Lighthouse, to measure site speed and gather insights on any adjustments that can be made to improve your overall page load time. It is a good practice to execute site speed tests on your site periodically and prioritize site speed as a core metric.
Below is a report from PageSpeed Insights.
At Portent, we perform page speed audits periodically for our clients, and you can contact us to learn more about our process.
Wrap Up
The six metrics above are particularly important to provide visibility and insights into your digital marketing campaigns. They are a great place to start and it’ll be interesting to see what new metrics become available in the future. I hope these six metrics can help you make data-driven decisions for your marketing strategies.


I’d add top referrers. It’s always good to track who is linking to your site organically so you can either reciprocate or at the very least give them a thank you. Adding that personal touch is a great way to socially market your site.
Great point Chris.
If you can create Google Analytics reports you can review some of these metric quickly each day/week. That’s one thing I’m going to work on this week for my websites.
in an ideal world I would add lead quality – given that sales leads are the goal.
There’s not much value in ‘Donald Duck’ leads.
Lead quality is a measure not many people keep in mind when measuring their Marketing campaigns. But it is crucial when it comes to measuring campaign effectiveness and its impact on revenue.
Best Regards,
Mira
Yah, I’m not a fan of Disney leads myself.
Very, very helpful, Ian – thanks for posting this. I would just add the need to monitor social media conversations. For example, in the hospitality industry, it’s useful to calculate the percentage of positive reviews (for example).
Yes that is true. These information are really helpful specially nowadays that most of us are engulfed on any social media platforms. These must be read by everybody.