
This post is somewhat advanced – I geek out quite a bit. If you don’t know what a server log file is, read about that, first, then come back.
Yesterday I explained why, in internet marketing, attribution is a mind-sucking pain in the ass. Not very satisfying, I know, because all I said was “This is really difficult” without providing any solutions. I was channeling Republicans. Tonight I’ll channel Democrats and provide a hopelessly complex yet plausible solution upon which no one will ever agree.
You can provide accurate attribution data. It’s hard, but it’s doable. All you need are:
- A web server configured to log referrer data, cookies and the usual stuff.
- Microsoft Excel, or the database software of your choice, or a nice log processing tool.
- A healthy dose of chocolate, alcohol or other drug.
Love the log files
First: You have to learn to love your server log files. Don’t wince – it’s not that bad. Sure, we all do analytics by pasting a handy little javascript onto our sites. But when I was a wee bairn we had to churn through huge server logs using nothing but punch cards and our bleeding fingers, you young whippersnapper, so deal with it.
Your server logs are a fantastic data store. There are lots of great things you can learn from them. For our purposes, here, though, we’re going to focus on attribution.
Step 1: Determine your conversion goals
First, you need to figure out what counts as a conversion on your site. A conversion might be an e-mail newsletter signup, or a purchase, or something as simple as a visitor reading one specific page.
Step 2: Find the goal page
When a visitor completes a purchase, they land on a ‘thank you’ confirmation page. If they sign up for your newsletter, they land on a different page that says ‘thanks’. Those pages are goal pages. Every time a visitor views one, they’ve done something you wanted them to do.
I’m going to use one particular page on my blog – the Speaking page – as my goal page. The page filename is ‘/colloquium’. I just want folks to read it, nothing fancy.
Step 3: Get the log files
Get your server log files. You don’t need all of them! On a site that gets more than 10,000 visits a day, a year’s worth of log files could clog every tube on the interwebs. Instead, choose a time period you want to survey, and get a limited set of logs.
If you manage your own server, this part’s easy – you should already know where those log files are.
If you’re using a service like Media Temple, then you can download your log files via your control panel.
And, if you’re at a humungous company with an IT department, you can ask them to give you access to the logs.
I’m going to use Conversation Marketing’s log files: 2 days worth. On to step 4.
Step 4: Pick your tool
The raw log files are an ugly blob of text. You’ll need some kind of tool to help you sift through the data. My favorites include:
- Microsoft Excel, for smaller logs. Excel tends to vomit all over the place when handling more than 60,000 rows, though, so it really does only work for smaller log files.
- A database program like MySQL or SQLite. With these you can process hundreds of thousands of rows (records). But you need to know how, and most database software will eventually bog down.
- A log file analyzer. I’m not talking about web traffic log analyzers like Webalizer. I’m talking about industrial-strength analysis tools like my favorite, Splunk. These tools let you process hundreds of thousands of rows, sort and sift, and dig out whatever data you need.
- Crunching through the files using Grep. You can read this post about SEO log file analysis to get the basics.
For now, I’m going to go with Excel. It’s a hell of a lot easier, and my log file is really small.
I’m also going to assume you know what the log file is, and how to interpret it. If you don’t, do some homework first.
Step 5: Scrub the log
There’s a lot of stuff in the log file that you don’t need. I usually remove:
- All non-HTML file requests.
- Columns I don’t need, like hostname, server IP, etc..
- All requests made by bots.
All you need is the visitor IP address, the referring page, the requested page, the cookie, and the date/time. The more you clean up, the easier it’ll be to work with.
Step 6: Sort and format
In Excel, I sort by cookie and then IP address, and then date. Then I use conditional formatting to highlight any page request for the goal page. The result looks like this:
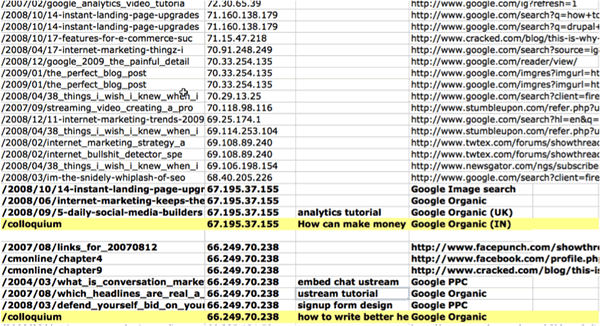
See that? Each bolded list is one visitor’s many visits to my site. Note how these visitors came from many different places over time: The same person came to my site from ‘Facepunch.com’ (?!!), Facebook.com, Cracked Magazine, and then a combination of PPC and organic search results. This is a very complete picture of their interaction with my site.
Step 7: Enjoy the fruits of your labor
Now you have a true picture of how each conversion unfolded. Look at this sample – the stuff outlined in red is the referring history for a single visitor, ending in a conversion (since /colloquium is my conversion page):
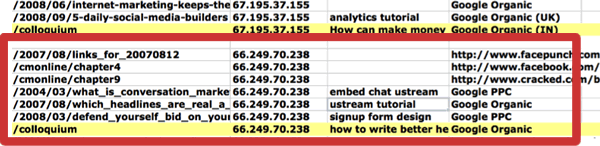
If I was using a typical analytics tool and applied the default last- or first-click attribution, the 2nd conversion would’ve been attributed to Facepunch.com or a Google Organic search on ‘how to write better headlines’.
With my quick-and-dirty log file analysis, I can see the attribution picture is much more complex. This person came to my site from lots of different referrers and keywords before they converted. Every one of those referrers/keywords played a part, so it’s important that I not rule them out.
It’s ugly, but it’s also full attribution: If I see that 4 visitors came to my site from a search for ‘ustream tutorial’ at some point, and then later converted off a different search, I’ll still note ‘ustream tutorial’ as a valuable phrase. If I were using a tool like Google Analytics, I would’ve missed that, because ‘ustream tutorial’ wasn’t the first or last click before conversion.
A more accurate attribution picture
If I process entire log files this way, I can start to get a more accurate picture of which pages truly contribute to conversions. I can collate the data and find patterns like:
- 50% of visitors who read the colloquium page visited my site first from a referring site, then from long-tail keyword searches like ‘ustream tutorial’, and then from ‘how to’ searches.
- 40% of visitors who read the colloquium page read a portion of my online book, first.
Those are great insights. If you just go with typical analytics tools and first- or last-click attribution, you won’t learn any of that.
So, learn to love your log files. It’s not the easiest thing in the world, but it pays off in the long run.
I hope this was helpful. It’s super, super geeky stuff. If you liked this piece and found it useful, let me know in a comment. If there’s a part of this that needs more explanation, let me know that in a comment, too. If you know of another tool that will do all of this work in 2-3 clicks, don’t tell me – it’ll just make me sad.


Another excellent, eye opening, and humbling post.
This gets bookmarked, starred, and highlighted as something I need to figure out sooner than later.
I really don’t know how you come up with so much relevant information and make the time to write about it so proficiently.
Thanks again Ian
Brilliant! This is why I still use log files for personal e-commerce ventures and projects.
Sometimes I think JS tags wrecked web analytics; they produce a ton of useless information and obscure important details.