So you’re in the market for a free visualization tool, and you’ve decided on Google Data Studio. We love GDS, and use it regularly at Portent when reporting on performance to our clients.
Here are some things to know and general tips about Google’s answer to Tableau before you go headlong into creating dashboards for your whole organization.
Educational Resources
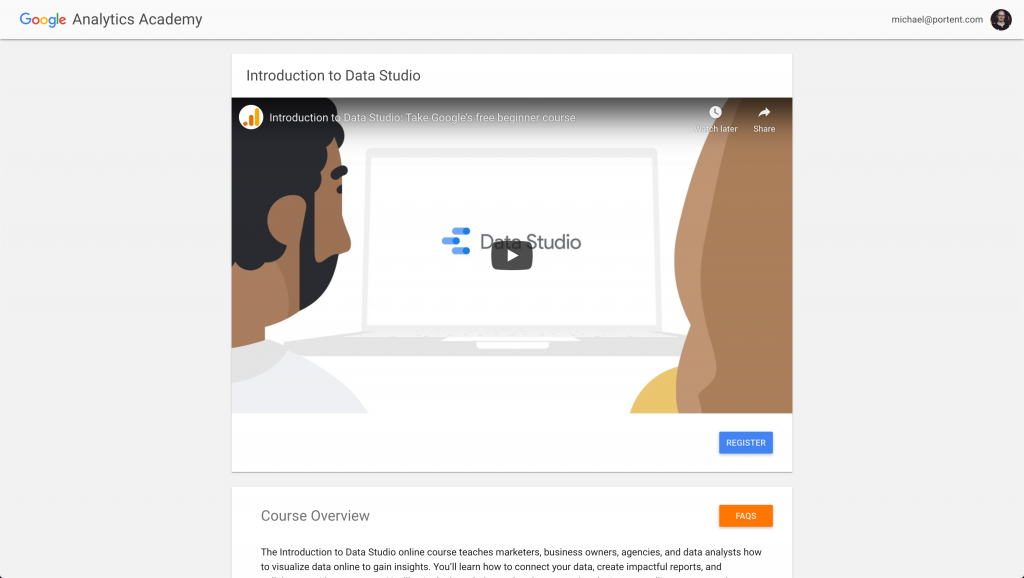
If you consider yourself a beginner, first you’ll want to get up to speed on the 101-level stuff. I’m not going to reinvent the wheel when Google has its own walkthroughs on Analytics Academy. Bookmark this post, go there and complete their Introduction to Data Studio course, and come back when you’re done.
Continued Learning
Beyond the basics, there are several companies and folks on Twitter that are great follows on Data Studio. A couple of my favorites:
- Lee Hirst from Helpfullee has a bunch of dashboard templates
- Bounteous is an agency that offers more hands-on training beyond Google’s Analytics Academy
Connectors
Data Studio works by bringing data together through “connectors.” Some are free and native to GDS, and others are paid, non-native community connectors created by third-parties. Getting your data into the tool gracefully will make or break any dashboarding initiatives you undertake with it.
Native Connectors
Google has a variety of connectors to its own properties, including Google Analytics, Google Ads, Google Search Console, BigQuery, and even Google Sheets. Those are plug-and-play with any accounts, projects, or files you have set up there.
Community Connectors
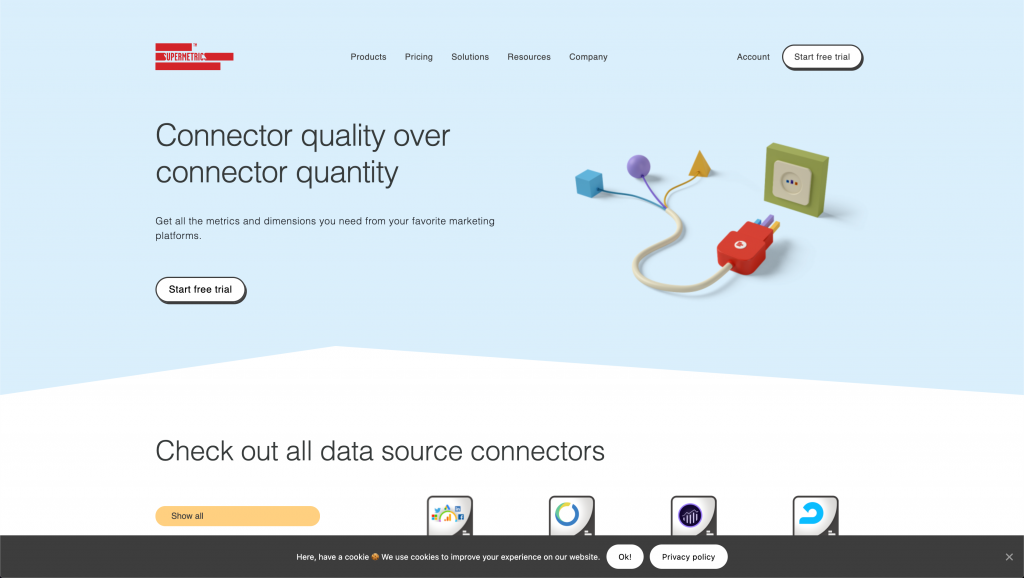
For any non-Google properties—Facebook and Microsoft Ads, for instance—you’ll need to employ “community connectors,” which often come at a cost. But compared to what you’d spend writing your own API connectors and paying for database storage, paying for a suite of connectors from Supermetrics (which runs $39/month) will seem like a steal.
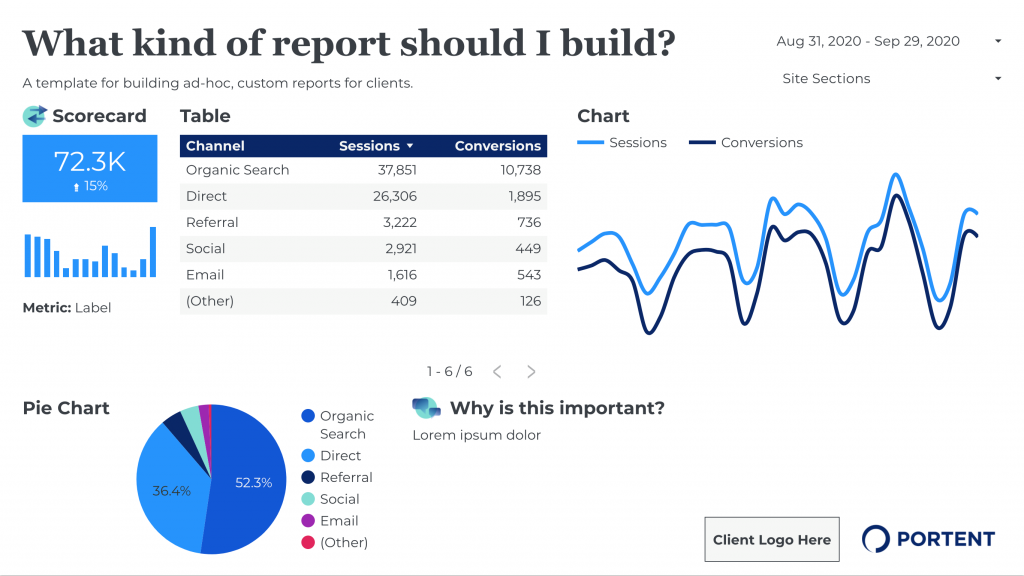
Exploration
Once you have the data sources configured, the Explore section of GDS allows you to effectively stage visualizations and test different styles, dimensions, and metrics before incorporating them into a permanent dashboard.
Some visualizations I would start with are:
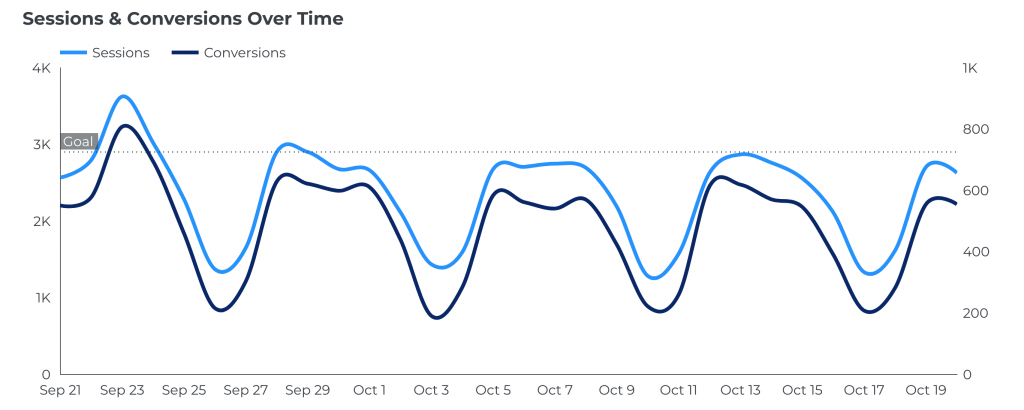
Time Series Chart
Nothing beats demonstrating progress on your metrics over a stretch of time. Data Studio gives you a lot of flexibility around breakdown dimensions and even adding a reference line to show if you’ve exceeded a goal.
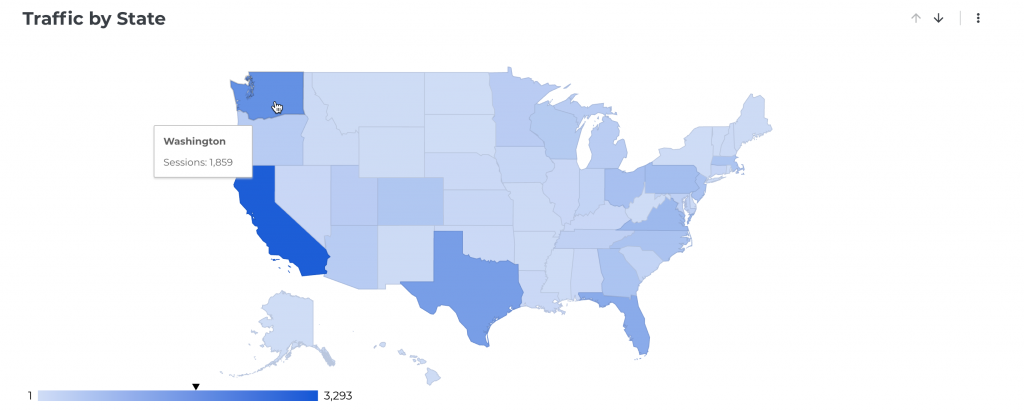
Geo Map
If you’re visualizing a lot of localized data points, Data Studio’s integration with Google Maps can give you incredible latitude (see what I did there?) in how to surface those metrics to end-users.
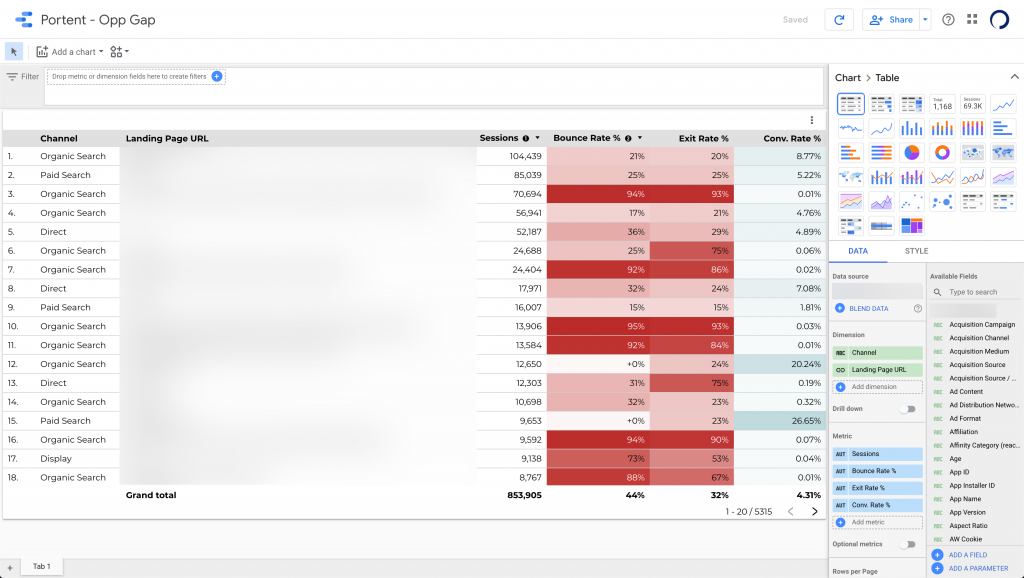
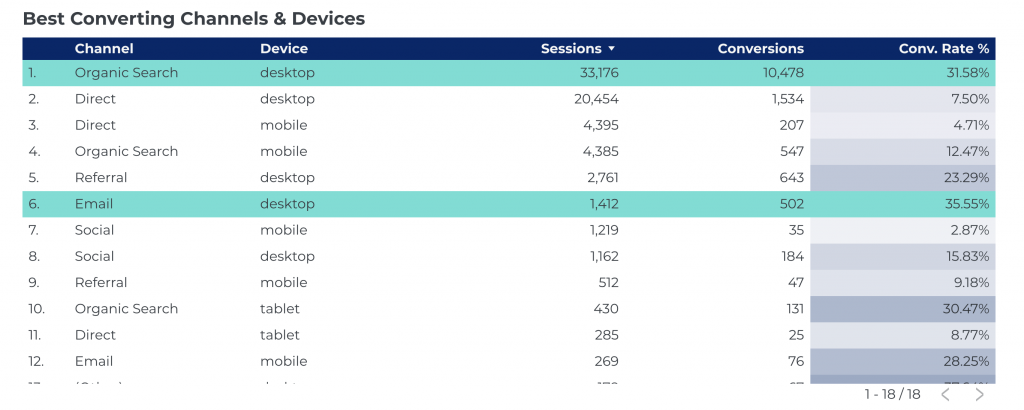
Tables With Heatmaps
Sometimes all the fancy charts and graphs in the world can’t replace the easy-to-use table. GDS has recently added functionality to highlight cells in the table when they meet certain conditions.
Style Guides
After you have a few core visualizations you want to build a dashboard around, it’s important to set global styles for colors, typography, and white space so that you create reports for your organization that are on-brand and consistent in look-and-feel. A poor visual design can distract from the data and insights you hope to derive from the dashboards.
For additional tips, check out this blog post on creating an impactful marketing dashboard.
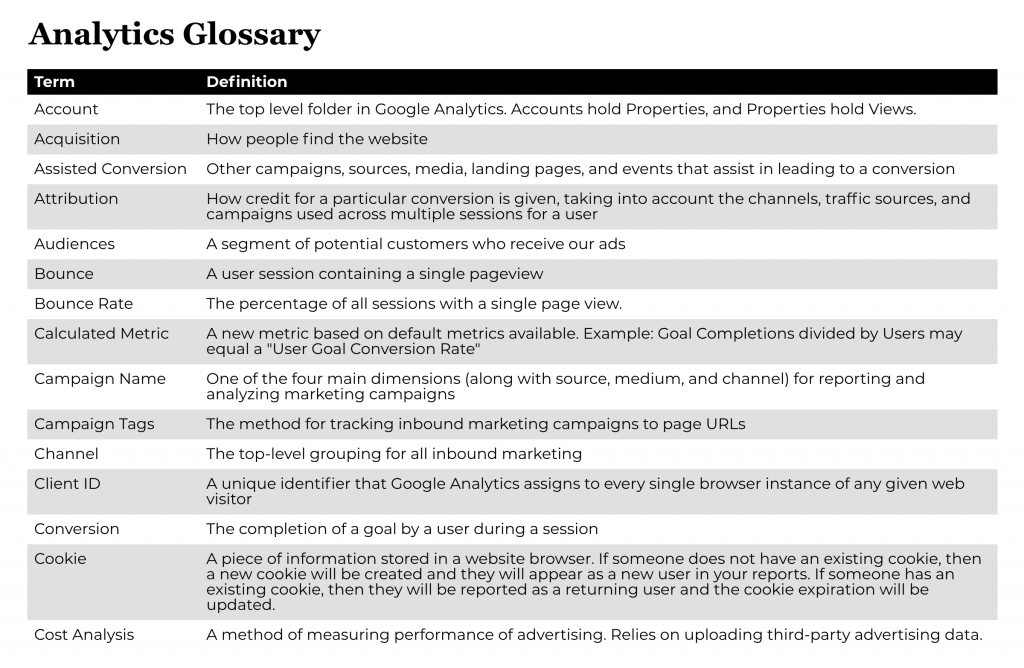
Glossaries
Users of your Data Studio reports might have questions about what the dimensions and metrics mean. So it’s important to keep those definitions built into the report and easily accessible.
Sharing Reports
Since GDS is built on the Google Docs backbone, it allows you to share reports easily with folks in your immediate organization and stakeholders on the outside as well. You can also make certain pieces of it publicly available for things like published studies or reports.
Next Steps
Google Data Studio’s product team is one of the fastest iterating teams at Google, for my money. So if you feel like it’s missing functionality you need today, check back in a few months and it’ll probably be added. And if you really want to get obsessive about how your reports are being adopted in your organization, you can even add Google Analytics tracking to your reporting templates! There are so many ways you can evolve your dashboards in GDS once you have them built out.