
Competitor benchmarking provides an opportunity to judge the performance of your site objectively by helping you understand how your business should be behaving online.
This wouldn’t be possible or accurate, however, without following a process that ensures you’re analyzing the right competition and metrics. Competitive benchmarking analysis should be highly curated and scrutinized to avoid undershooting or overpromising from benchmarking against the wrong competitor.
Why Do Competitive Benchmarking?
The insights gained from competitive benchmarking allow you to set feasible goals, identify opportunities, and compare your performance against industry standards.
Set Feasible Goals
Competitive benchmarking prepares you for initial goal-setting conversations through understanding what metrics and goals may accurately reflect true signs of growth and success for a given business or industry.
It’s inaccurate to judge the performance of a site against what you’ve “typically seen” from other brands. We can’t compare revenue for a nonprofit against an online retailer. We can’t even compare performance across B2Bs that are in similar industries. This research enables you to educate yourself on how your business actually behaves online versus how you think it should.
Compare Against Industry Standards
We get asked all too often, “Is that good or bad?” in response to things like “your conversion rate was 7.5% last month.” Well, that’s pretty amazing for an online retailer but not anything to celebrate for a nonprofit. Competitor analysis involves industry research, so you can be prepared to answer these questions on the spot.
Make sure you’re aware of what’s “standard” in your industry. There are plenty of credible sources out there that publish studies on standard rates by industry. Research your industry’s standards and make sure the studies were published in more recent years.
Identify Opportunities
Ongoing competitive benchmarking analysis is an efficient method of coming up with new ideas and opportunities. Once you have a set list of competitors, you can easily see which ones are ranking for more or fewer keywords than your site is and identify those keywords through tools.
Identify your top one or two competitors and pull their keyword ranking lists from SEMRush. Check your list of ranking keywords from GSC, SEMRush, or Ahrefs to see if there are entire sets of keywords that your competitors are ranking for that you’re not. Check out this blog post for some more information on keyword research tools.
Lastly, you can monitor this list to see when competitors start increasing in metrics like Share of Voice (SoV). If you’re keeping a close eye on your competitors’ SoV, you may be quick to identify a new hub page, product offering, or UX changes that are causing these improvements.
How to Do Competitive Benchmarking
Conduct competitive benchmarking as a part of your strategic planning meetings and revisit it occasionally outside of these meetings to refresh your competitor list. You can effortlessly monitor competitor performance if you do a thorough setup in the beginning.
Complete a competitive benchmarking analysis through the following steps:
- Conduct industry research for rate metrics
- Identify your competitors
- Create a report of competitive metrics
- Conduct the analysis
Identify Competitors
Use a few tools to gather a list of online competitors through your own research and add it to a list of competitors identified internally by your team. Your final list should be three to five competitors and include the following types:
- Reach
- Immediate
- Offline
Reach Competitors
Start high-level by identifying target keywords and see who’s always outperforming in your industry. Track this set of keywords in a tool like STAT, which will provide insights into SoV and Top Ten Domains.
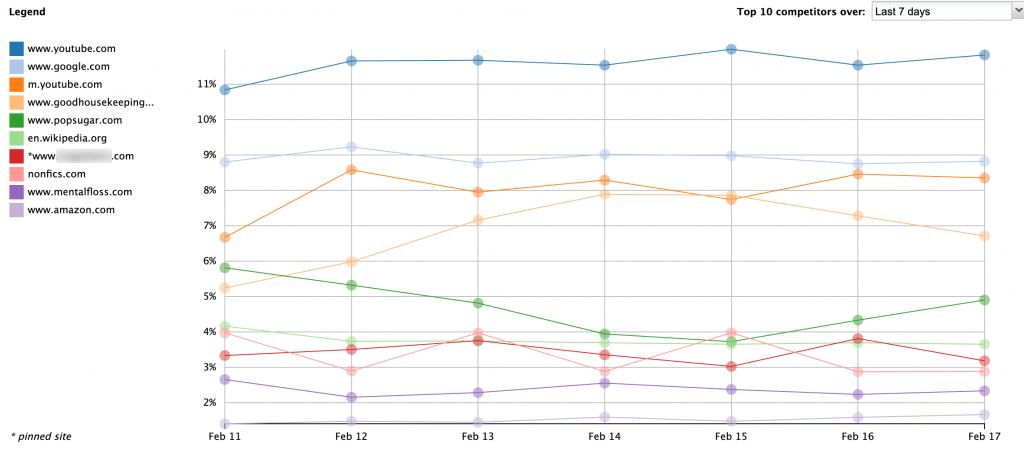
The top performers in these reports will be your reach competitors—the sites that are ranking for exactly what your site should be ranking for. Of course, it’s important to be realistic when choosing competitors from these reports. Be sure to check these reports across multiple Data Views or Tabs to get competitors for specific keyword sets.
Immediate Competitors
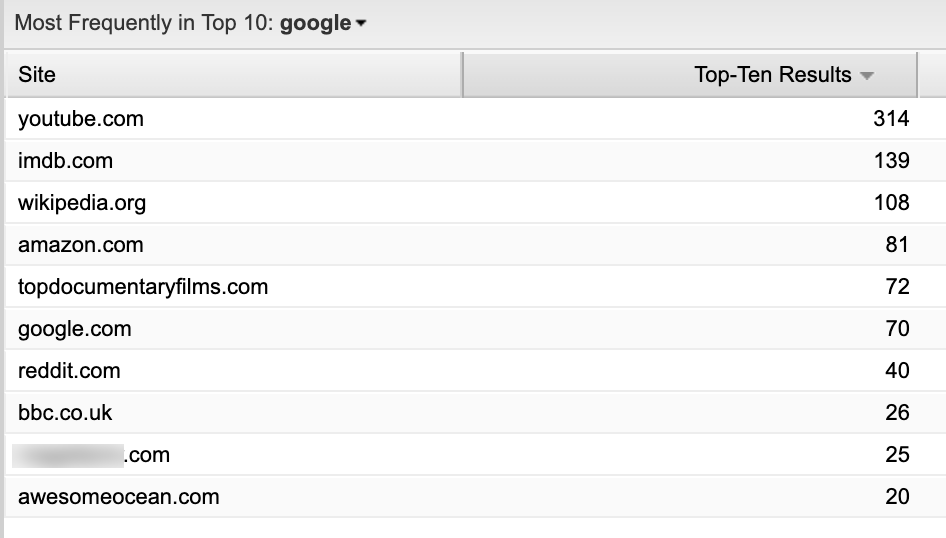
Use competitor research tools like Google Search Console, SEMRush, and Ahrefs to find your immediate competitors who rank for keywords that you already rank for.
Pull the list of ranking keywords from Google Search Console, clean up the list, and track those in STAT as well. Look at the same two reports, as mentioned in the previous section, to see which sites are ranking most often for the set of keywords you already have visibility for.
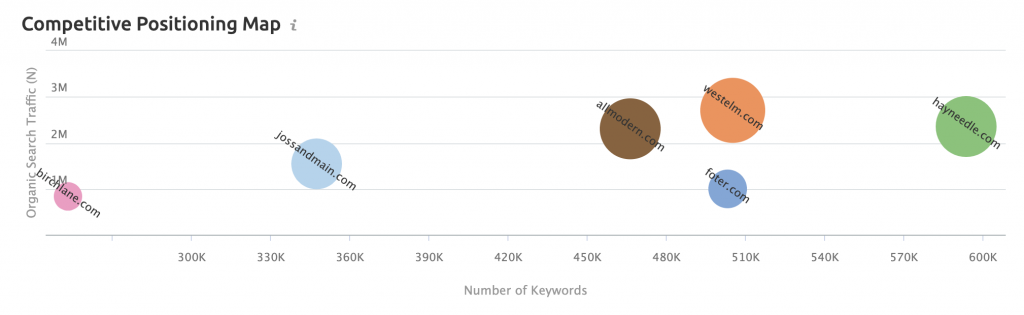
Use SEMRush’s Competitive Research tools to see which sites appear alongside your site most frequently through the ‘Competitive Position Map’ report.
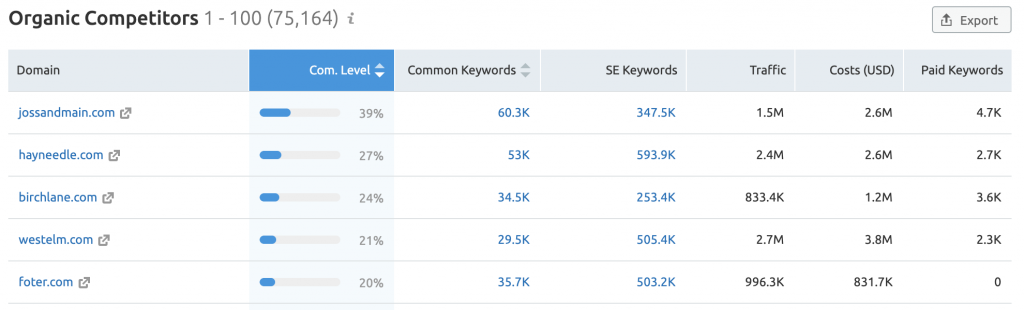
The ‘Organic Competitors’ Report in SEMRush can also provide a general comparison of how many keywords these sites rank for and how much traffic they’re estimated to receive. You can use these numbers to compare your site’s performance against to see if these are realistic competitors.
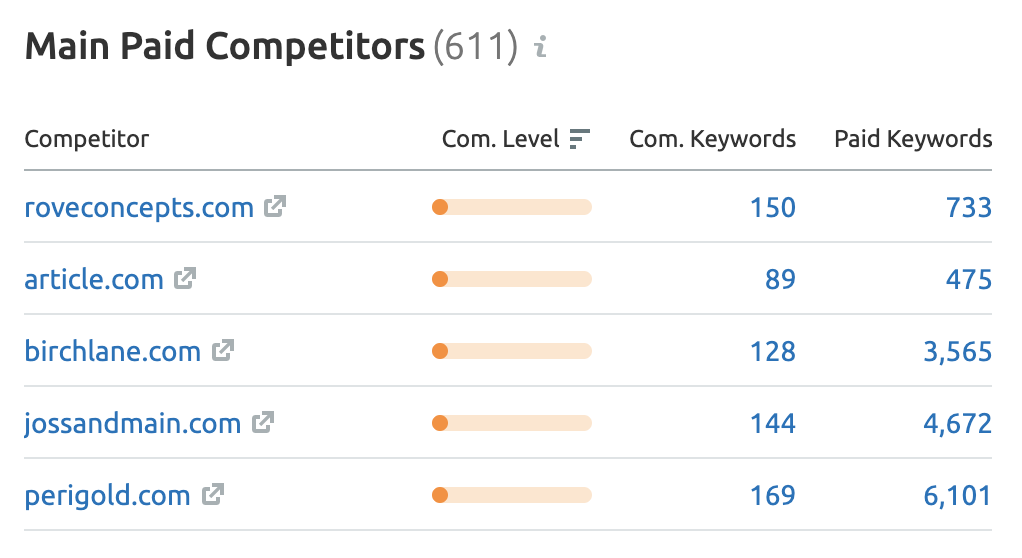
Use Ahrefs to take a look at what it has captured as your immediate competitors for Organic and Paid Search. Navigate to the ‘Paid Search’ section of the dashboard and find your list of paid competitors in the ‘Main Paid Competitors’ section.
Offline Competitors
Don’t forget to include offline competitors—the competitors that you see your business competing with out of the digital space. Offline competitors may be ones that you have direct competition with at your physical location or ones who have booths at the same conferences but may not have the same digital presence. You may, however, still discover that some of these competitors overlap with ones that were found in your own research.
Do a quick review of the ones that weren’t included to see if they’re sites you want to measure against. For example, a direct offline competitor may have little to no online presence, which we wouldn’t want to compare our performance against.
Identify Pertinent Competitive Metrics
You’ll choose the metrics to include in your competitive benchmarking analysis depending on the services provided, but it’s important to look at a mix. It also makes more sense to focus more on ratios or rates over absolutes. For example, your site may be too new to see the same amount of traffic as a competitor’s. Still, you may have an above-baseline conversion rate for your industry, which is a better indication of current success.
Typically, my competitive benchmarking reports include the following metrics:
- Organic Share of Voice (STAT)
- Paid Impression Share (Google Ads or Adthena)
- Top Ten Domains (STAT)
- Domain Authority (Moz)
- # of Referring Domains (Ahrefs)
- Conversion Rates (Industry Standards)
When tracking SoV and Top Ten Domains, be sure to consider them for the entire site versus by Data View. You could track sets of keywords that would indicate success for specific goals and monitor those separately.
Automating Competitive Benchmarking Analysis
Once you’ve set your competitor list and decided on which metrics are important to keep an eye on, you should keep a regular schedule of checking up on them or set up a report or slide.
I create slides for competitive metrics within Google Data Studio through connectors to automate my competitive benchmarking analyses. We use them mainly to identify drastic changes in SERPs among our competitors and to identify a high-level area we should dig further into.
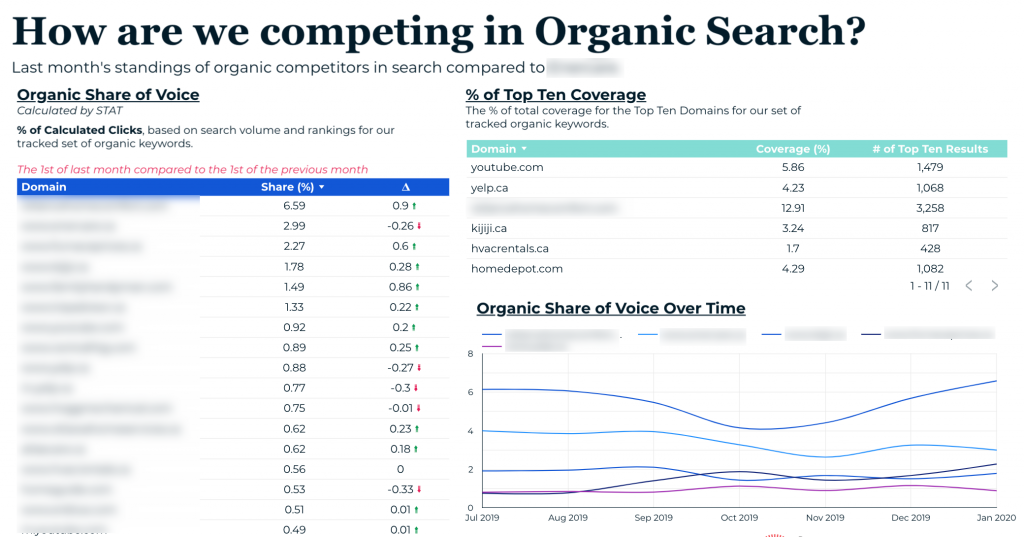
I typically split up my metrics by channel or at least group them into sections. Here’s an example slide for Organic metrics:
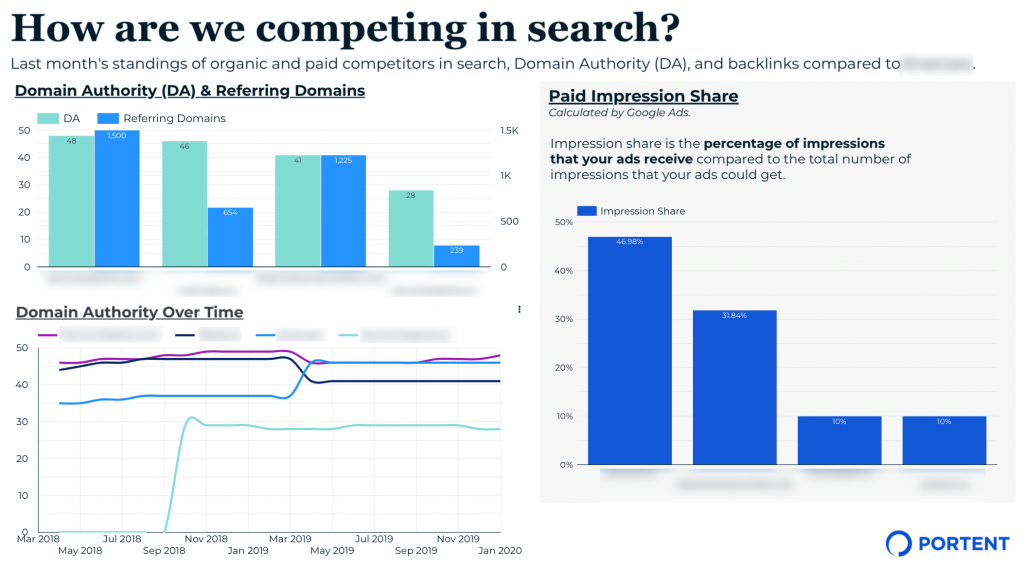
And an example for Paid Search and Off-Page SEO metrics:
I automate as much as possible within these reports so that we can consistently see changes among our explicitly provided competitors and identify new ones that may crop up.
Anything that has an API is tapped into and set up to pull specific metrics. However, some metrics can be pulled without any additional configurations and others that, unfortunately, can’t be pulled automatically. This is the order I work in, from most preferred to last resort:
- Use a built-in connector in Google Sheets, like Supermetrics or the Google Analytics Add-on
- Set up a database through the API
- Manually export data into a Google Sheet
I try to set up automatic runs for all three of these options. There are options to schedule your sheets to update in certain increments of days, weeks, or months, even at specific times of the day. Our SQL databases are configured to run on certain days of the month.
The trickiest part is the exports into Google Sheets. Oftentimes, you may be lucky enough to enable scheduled email reports. However, there will be instances where the data can only be pulled manually. Paid Impression Share, for example, is a metric that’s not customizable through the Google Ads connector and doesn’t offer scheduled emails.
Once the slides are created, I ask each analyst for their take on what we’re seeing to make sure we’re not reporting SoV for too high-level of a data view or to check if any competitors should be removed from our visualizations and tables.
We set MoM comparisons on tables and look at change over time in line graphs to make competitor benchmarking an ongoing analysis. Regularly analyzing metrics at this level allows us to understand which of our competitors may be “reach” competitors and when we’ve hit a new level of growth by surpassing one.
With all the said, competitor benchmarking can be even more customized than what I’ve walked through, so feel free to explore other metrics and platforms for visualizations. Either way, remember to take the extra steps when identifying the right set of competitors and to automate as much as possible to give you more time for analysis.


Thank you Oeuyown for this insightful article.
You wrote: “[..] there will be instances where the data can only be pulled manually. Paid Impression Share, for example, is a metric that’s not customizable through the Google Ads connector and doesn’t offer scheduled emails.”
It’s possible to automatically display the impression share into Google Data Studio. Here is the GDS setup I’m using: https://imgur.com/a/Kg9RBE0 It’s possible to display this data for longer periods and chunks of time.
Hi Stijn, thanks for sharing your setup! Great point—impression share is indeed able to be pulled through the connector directly to GDS. I’ll make an update to my post!
However, I’ve had difficultly customizing the GDS connector for a specific ad group. For example, I only want to report on impression share excluding my brand campaigns. GDS breaks when I attempt to filter for any ad groups. I would love any suggestions!