Quality Score is a key metric that should be used to indicate the potential for keyword, ad group, and campaign success in paid search.
On its face, Quality Score is simple: it measures the relevancy and cohesiveness of three components required for every PPC campaign:
- The keywords within an ad group
- The ad copy searchers see when an ad is triggered
- The landing page searchers visit after clicking your ad
The more relevant and cohesive those three components, the higher your Quality Scores will be. Simple enough, but let’s dig in a little deeper.
Why is Quality Score So Important?
Before diving into how to maximize your QS, it’s important to understand why improving Quality Score is important.
Quality Score matters because the QS of a given keyword directly impacts Ad Rank in the auction.
The higher your Quality Score, the better your Ad Rank has the potential to be. As Ad Rank improves, the chances of your ad earning a click grows and the cost you’ll pay per click can decrease.
The bottom line: Having a high QS sets you up with the best chance to pay as little as possible for the ad position you earn and the clicks you drive.
By saving money there, advertisers can see improvements in cost per conversion figures and can drive more traffic to their targeted pages if they are constricted to stay within a set spending budget.
How to Maximize Quality Score
There are three primary metrics which guide the QS assigned to a given keyword.
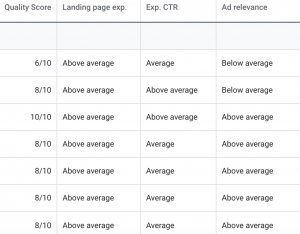
Advertisers can see the status of these factors when analyzing Quality Score in Google Ads as each will have a status of “Below Average”, “Average”, or “Above Average.”
Here’s a snapshot of what advertisers can quickly view in the Google Ads interface for these metrics:
Expected Clickthrough Rate
Google defines Expected CTR as “A keyword status that measures how likely it is that your ads will get clicked when shown for that keyword, irrespective of your ad’s position, extensions, and other ad formats that may affect the prominence and visibility of your ads.”
To measure Expected CTR, Google looks at your keyword’s CTR history along with those of your competitors to predicte how often it will be clicked.
To maximize Expected CTR, write your ad copy for high relevance to your keyword list. The keyword list carried within your ad group should tightly-align with the copy of your ad. The closer they align, the more relevant that connection will be and the higher your actual and expected CTR should be.
Building high relevance between your keyword list and corresponding ad copy is vital to driving Expected CTR.
Additionally, because a high ad position towards the top of a SERP can increase your chances of a user clicking through, try increasing your keyword bids to raise your average position. Over time, a higher ad position should help your historical CTR performance. But be careful doing this- if your ads continue with low CTRs at a higher ad position, you risk a decrease in QS.
Ad Relevance
Ad relevance “measures how closely related your keyword is to your ads.”
Google refers to your ad copy and landing page content to predict how relevant your ad will be to a user who triggers your ad with a given search query.
To maximize ad relevance, ensure your ad copy directly relates to the keyword list it corresponds within a given ad group. Also, ensure your ad groups contain small, tightly-themed groups of keywords so your ads can be tailored to them closely. Lastly, ensure your landing page contains content as equally relevant to these keywords and the ad copy you use.
Landing Page Experience
Landing page experience is “a measure that Google Ads uses to estimate how relevant and useful your website’s landing page will be to people who click your ad.”
To measure landing page experience, Google refers to your landing page content as well as other metrics like bounce rate and page speed to predict how good of an experience a user will have once they click through your ad.
Optimize your landing page’s content to be both relevant and authoritative to maximize your landing page experience. Additionally, think about landing page performance in regards to user experience, conversion rate optimization, and load time to drive engagement.
Does It Actually Work?
I’m sure for many of you, this all makes sense in theory. But do changes in Quality Score actually make a noticeable impact on the campaigns we optimize on a daily basis?
Short answer: Yes.
Those of us in this space have always been told Quality Score is important, but it’s hard to see how QS changes actually impact our numbers over time. Hat tip to Google for making it so difficult to analyze historical Quality Score changes. But, if you isolate some keywords which have shown a change in Quality Score and segment your data by day, you can see a very real impact.
Here’s an example from an account we manage at Portent. In this instance, a keyword saw its Quality Score increase from 7 to 8 and then back down to 7 again after a few days. To see the impact of this change, we measured against the keyword’s Avg. CPC and Lost Impression Share due to Ad Rank over the same time period of time:
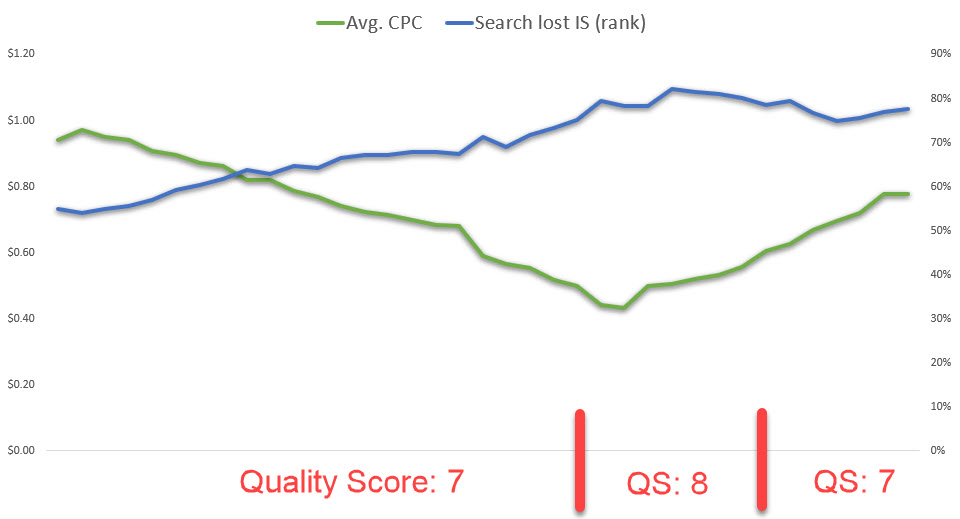
*Note: we used a 7-day rolling average of both of these metrics to make the data easily digestible.
This graph shows that during a time period when we decreased bids to compensate for a lower budget, our Lost Impression Share due to Ad Rank— what Quality Score directly impacts— increases at the same steady rate as the Quality Score stays static at 7.
When the Quality Score of the keyword increases to 8, our Lost Impression Share due to Ad Rank stabilizes as bids continue to decrease a bit and stay relatively low. Once bids begin to increase again, our Lost Impression Share due to Ad Rank decreases every so slightly.
After Quality Score changes back to 7, the Lost Impression Share due to Ad Rank stabilizes again and begins to increase even as bids continue to rise.
Other Factors Out of Your Control
There are other factors Google takes into account when assigning Quality Score which you have no control over as an advertiser. Competition for specific keywords in a given industry is the most prominent example. If you’re in an over-saturated search space with tons of competitors, you might never see a quality score over 5 for certain keywords even after extensive optimization.
How do you know if you’re in an over-saturated vertical? Try searching from one of your high-volume keywords and see what type of ad results show up. If you notice there are consistently 4+ ads on the SERP each time you search, you can bet competition is high.
You can also take a look at the auction insights report in Google Ads for any given keyword(s). If you see a list of 8, 10, or more competitors, that too is a sign you’re in a highly competitive market.
Don’t stress about what you can’t control. Focus on the three critical factors you can influence:
- Expected CTR
- Ad Relevance
- Landing Page Experience
Quality Score has a real impact on our paid search performance and how much we pay as advertisers for a given Ad Rank in an auction. While Quality Score should never be a key performance indicator that determines the overall success of your PPC strategy, you should pay attention to how these scores change over time and what impact that has on your performance.