
We’ve shared the importance of using data from a third-party reporting tool like Google Analytics and a social advertising platform to better understand and evaluate campaign performance. Using the two concurrently means that you can catch and mitigate reporting discrepancies and get a big-picture look at your advertising efforts across all channels.
For day-to-day performance updates, though, most social media marketers find themselves directly in the ad platform. With that in mind, this post will dive into Facebook Ads Manager and highlight some ways you can tailor native dashboards and reports to fit your needs.
Customize Your Columns
In the Ads Manager dashboard, Facebook’s columns default to the “Performance” view, which outlines campaign details like delivery and budget alongside standard performance metrics like results, reach, impressions, and more.
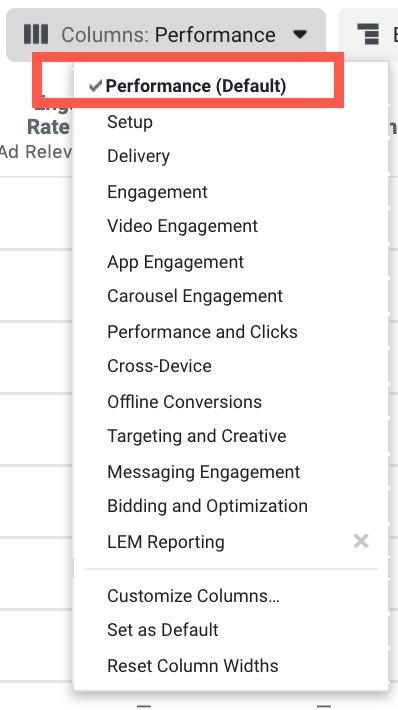
In the Columns drop-down menu, Facebook offers a number of canned columns settings in addition to the default, so advertisers can quickly monitor performance at-a-glance.
However, these dashboard arrangements are not one-size-fits-all. Depending on your campaign goals, applying a default column view probably means that you’re limiting visibility of the performance metrics that really matter to your campaigns, possibly losing out on valuable optimization opportunities.
This is where the Customize Columns feature comes in!

By selecting Customize Columns, you’re able to unlock any and all reporting metrics available in Ads Manager.
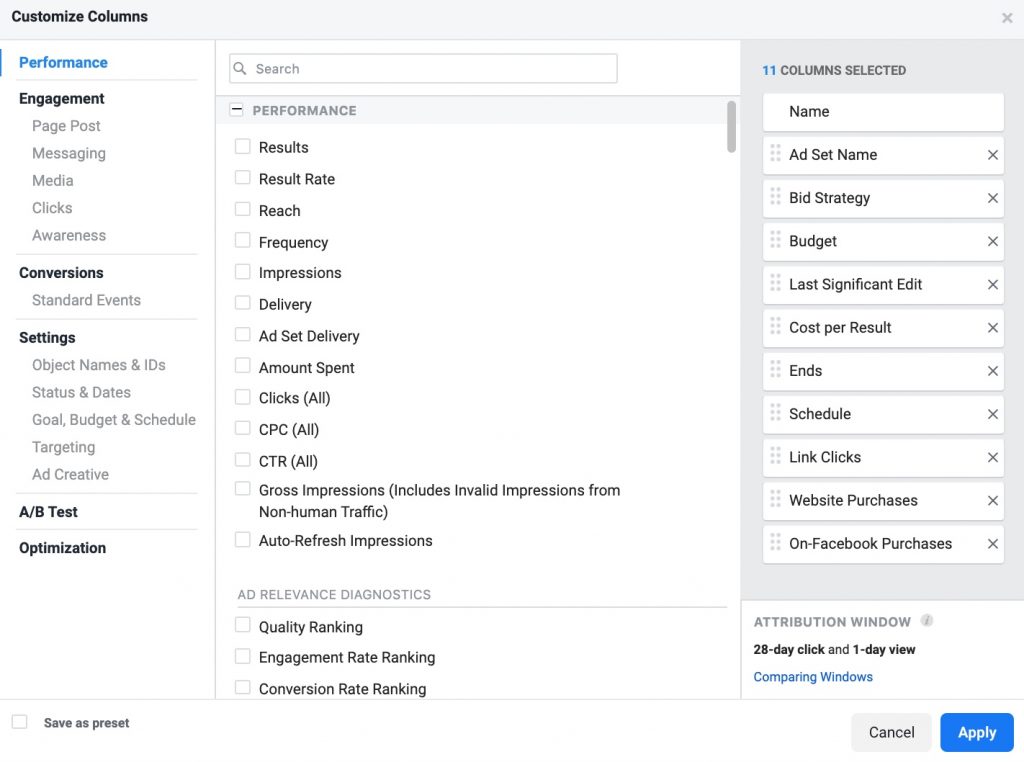
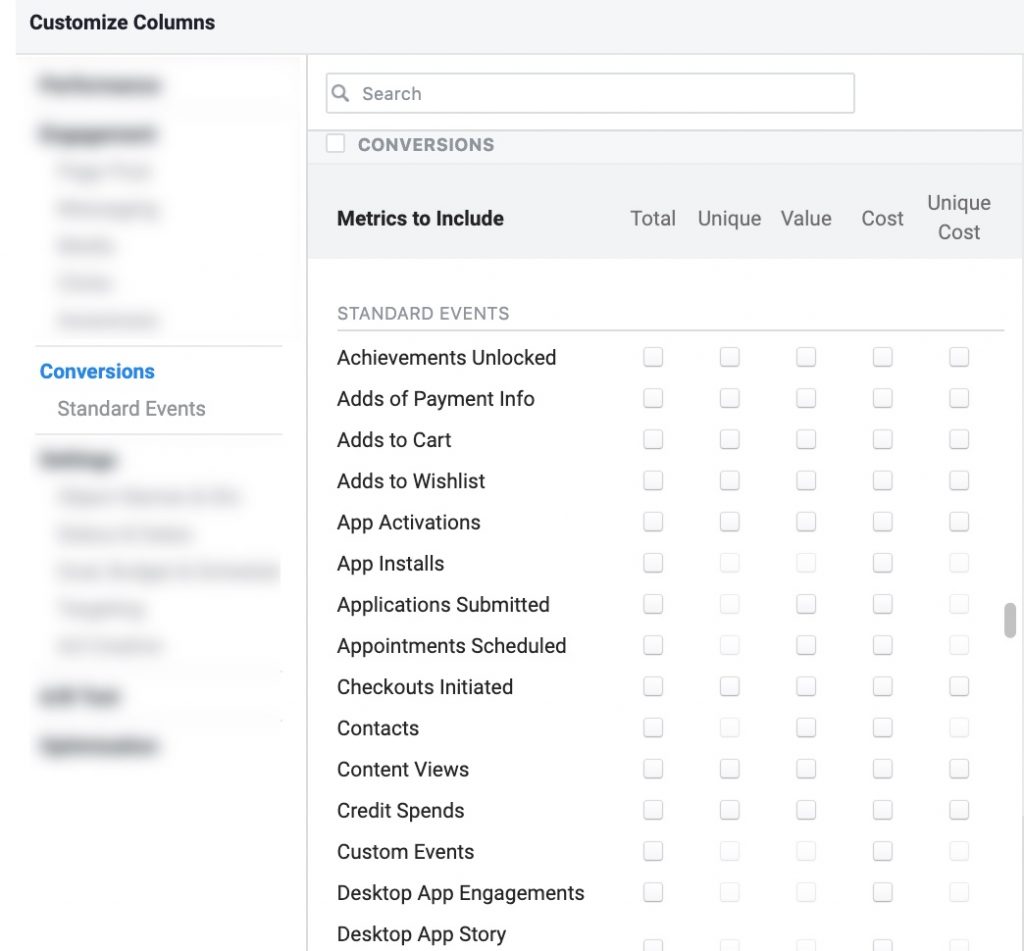
Here, you can opt to include the conversion event most relevant to your campaign, giving you a glimpse into performance beyond the “Results” column. All of Facebook’s Standard Events live here, but so do any Custom Events or Conversions you have set up that are being captured by your pixel.
Additionally, you can compare attribution windows beyond the 28-day click, 1-day view that Facebook defaults to, or the attribution window you’ve selected in your settings.
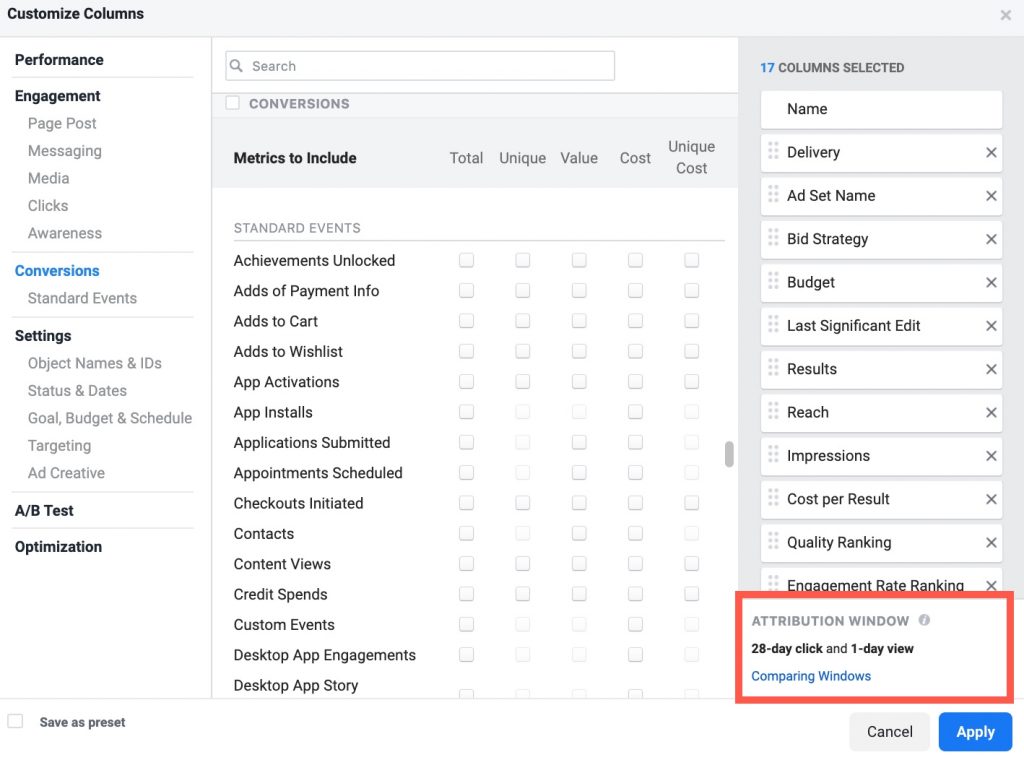

Adjusting your attribution window will not only help you make more accurate adjustments to your campaigns, but also develop a broader understanding of performance.
Check out this post if you’re looking to understand Facebook’s attribution windows better and determine the best setup for your business.
Any metrics you choose to add to your Custom Columns selection can be saved for later use in Ads Manager by selecting Save as Preset.
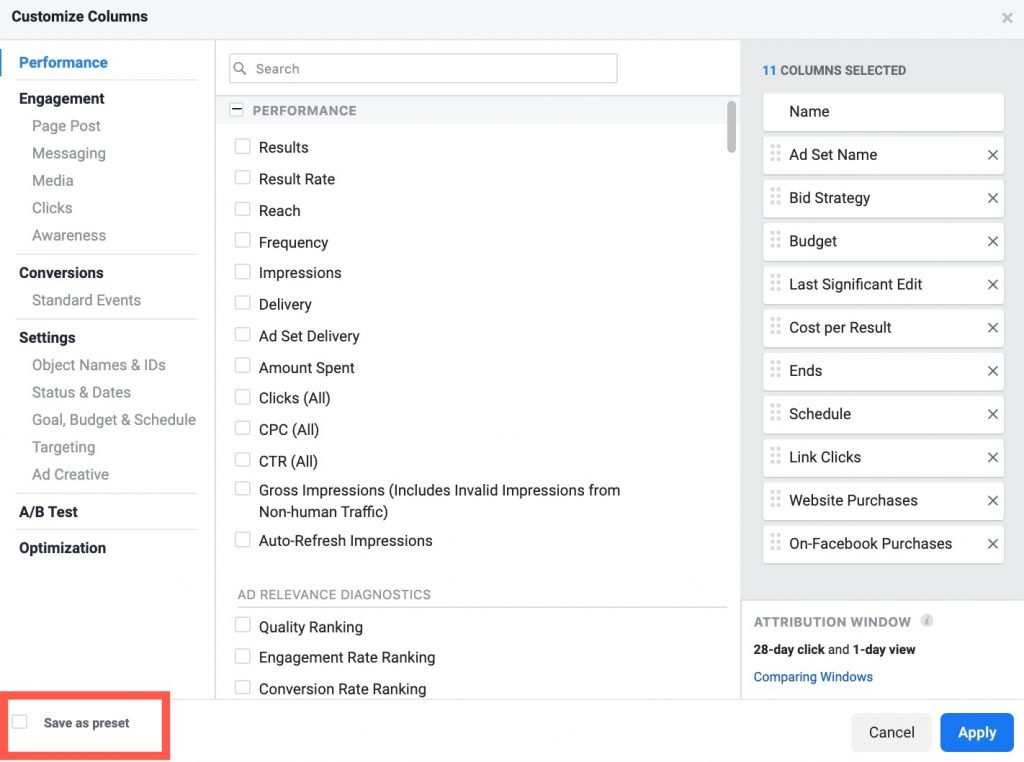
You’ll be prompted to name the preset, which will then be discoverable under the Custom Columns drop-down menu in your dashboard.
What Metrics Should You Include?
Given the seemingly limitless selection of metrics and performance views you can add to your custom columns preset, it can be challenging to determine exactly which options will be the most valuable to you as an advertiser. Again, there’s no one-size-fits-all approach to dashboard arrangement, but there are some guidelines you can follow for customizing your columns based on the types of campaigns you are running.
Keeping some of the standard performance metrics like CPC, CTR, Impressions, Reach, etc. is a great start. The trickier part can be deciding which conversion metrics are necessary to best understand performance, so we’ll focus on general needs depending on your campaign type.
Lead Generation
Lead generation can take a few different forms, but at the end of the day, you’re looking to capture user information that indicates interest in a product or service. For a business operating in a B2B vertical, this could mean sign-ups for a webinar related to a SaaS solution. On the flip side, a business specializing in professional services might want to measure sign-ups for appointment slots.
In any case, it’s valuable to have an understanding of the sales process and a user’s journey to conversion. While this should inform the attribution window you select, it can be helpful to customize your columns, so that you can compare results by attribution window.
If you’re driving to a lead form on your site, including Landing Page Views within your dashboard can help you gauge how many users are successfully landing on a page. With that in mind, any additional goals you are tracking should be reflected in your columns. This includes relevant standard event goals and custom conversions that give you full visibility into performance.
E-Commerce
If your conversion campaigns are optimized for a purchase event, those results will be captured on your dashboard without any column customization. However, getting the full picture of your user’s journey through the sales funnel can help you better optimize your campaigns each step of the way.
I recommend adding columns for additional conversion events like Add to Cart and Checkouts Initiated, and Website Purchases. This will allow you to see where users drop off in the journey to purchase and can inform retargeting campaigns with the goal of converting those users.
Purchase ROAS is probably the most valuable metric you can add to truly gauge campaign performance. With visibility into your return on ad spend, you can better understand the value of your marketing efforts. You can find this metric under Conversions in the Customize Columns menu.
How to Report on This Data
In a pinch, you can export the data as seen exactly on your dashboard in the form of a .csv file. If you’re looking for something a little more robust, the Ads Reporting feature allows you to customize and export a report directly from Ads Manager.
You can get there from your dashboard via the Export drop-down menu or the Shortcuts navigation in the top left-hand side of the interface.

From there, you can create a report by ad account. The toolbar gives you the option to customize by Breakdown and Metrics.
The Breakdown options allow you to view the report by:
- Level
- Time
- Delivery
- Actions
- Setting
- Creative Asset
On the metrics side, you can select from many of the options seen in the Customize Columns feature, as well as more granular settings like URL parameters and audience. Additionally, you can customize metrics by inputting formulas based on your additional reporting needs.

Why Use Ads Reporting?
While Facebook Ads Reporting won’t give you the ability to create data visualizations in the same way a reporting tool like Google Data Studio might, the reports generated in Ads Manager can be an effective tool for disseminating performance data to stakeholders.
Additionally, the ability to report natively by audience and placement can simplify your approach to optimizations.
Leveraging some of Facebook’s customizable dashboard and reporting features will not only enhance your understanding of performance, but also allow you to make more effective and strategic decisions as a social media marketer.


