Custom Reporting Closes the Loop
Our business communications client needed a way to tie expensive marketing efforts and hard-earned website traffic to offline sales discussions. Our closed loop reporting and analysis gave them that hard-to-get insight.
Analytics, Development
Telecommunications, SaaS
How does today’s marketing impact tomorrow’s sales?
The client works with multi-national companies that often take up to 18 months to arrive at a purchase decision on hardware and software solutions. With a long sales cycle, the client found it difficult to attribute marketing spend from months or years before deals directly.
Bridging the gaps between disparate data sources
With any closed-loop project, we aim to establish a stable first-party identifier (UID) for each website visitor and pass that into the client’s CRM with each lead form. From there, we can use that UID as a bridge to link marketing campaigns and website behavior to a customer’s progression in the sales funnel, from qualified leads to opportunities to closed-won revenue.
We also create a query that connects our UID to Google Analytics’ User Pseudo ID so that we can leverage Google’s cross-device analytics capabilities where possible. This allows us to map customer journeys that start on mobile devices and end on desktops and vice-versa.
Another critical strategy component involves providing UTM tagging consulting on advertising, email, and social media so that media spend can be aggregated appropriately across campaigns before running the data model.
Illuminating the drivers of success
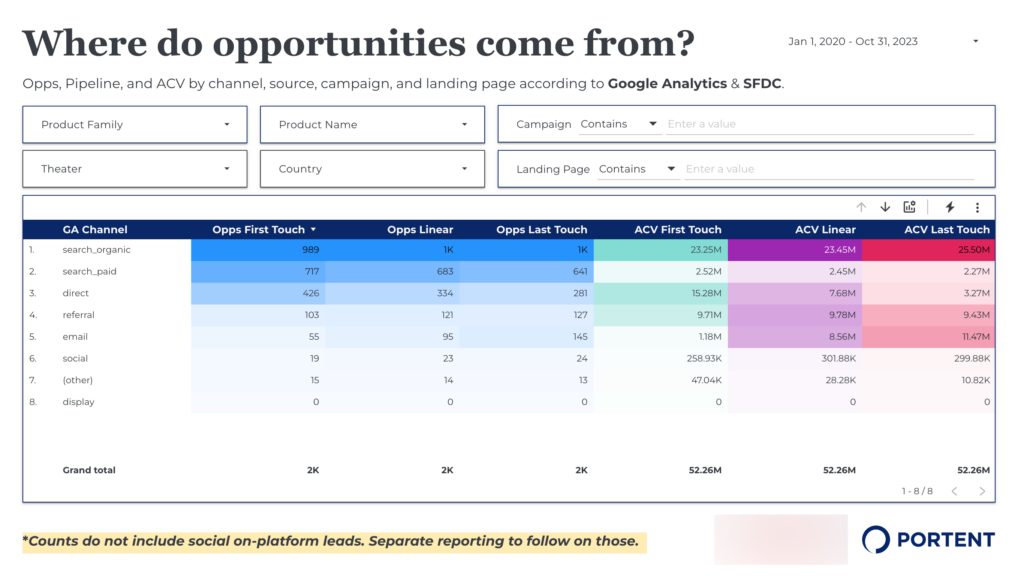
Portent set up the collection of a first-party identifier for the client in 2020. Over the next few years, we worked diligently to connect the data from Google Analytics, Eloqua, Salesforce, and several third-party advertising platforms, including Google Ads and Facebook Ads. Once the data was synthesized and validated in BigQuery, we ran it through three custom attribution models – first touch, weighted linear, and true last touch – to produce a fully automated closed-loop report. Armed with that reporting, we ran a quarterly analysis of the business outcomes it illuminated.
Not only did the client gain complete visibility into extremely long sales cycles for $52M in closed-won revenue across three years, but they also gained a better understanding of the channels and content that drove $30M in the pipeline still being actively worked by their sales team. The client and their agencies of record can now reverse-engineer the success and performance of the specific marketing activities that empower future sales.