
By now, you’ve most likely heard the news that Universal Analytics will stop processing hits on July 1, 2023. Google recommends that all Google Analytics properties move over to Google Analytics 4 as soon as possible.
One of the biggest, most impactful benefits of this move is the exporting of Google Analytics data into Google BigQuery. BigQuery allows scalable data warehousing and data architecture needs that integrate with the rest of your organization’s data. Using the rich data sets of Google Analytics in Google BigQuery can help you mine more impactful insights about your organization and your customers.
What Is BigQuery?
BigQuery is a product of Google Cloud and serves as a cloud data warehouse that allows you to query large datasets quickly and efficiently. Google Analytics 4 is an event-based measurement protocol. GA4 can count every action taken on a website, from page load to mouseover to form fill, as an event. This permits you to export all of your raw events from Google Analytics 4 properties to BigQuery. You can then use SQL queries to query that data or combine that data table with other data tables in your organization.
Why You Should Connect GA4 With BigQuery
One of the immediate benefits of Google Analytics 4 is the BigQuery export. Exporting all events into BigQuery is a must-have when setting up GA4. The standard reports GA4 can provide you with some instantaneous data, such as page visits, event loads, and conversions. That’s a good start, and your organization likely has other data sources in other locations, so I recommend setting up your connection to GA4 to BigQuery as soon as possible. Always keep in the back of your mind how this data can connect to other data sets in your organization.
The Export Integration step-by-step can be found in the Analytics Help of Google.
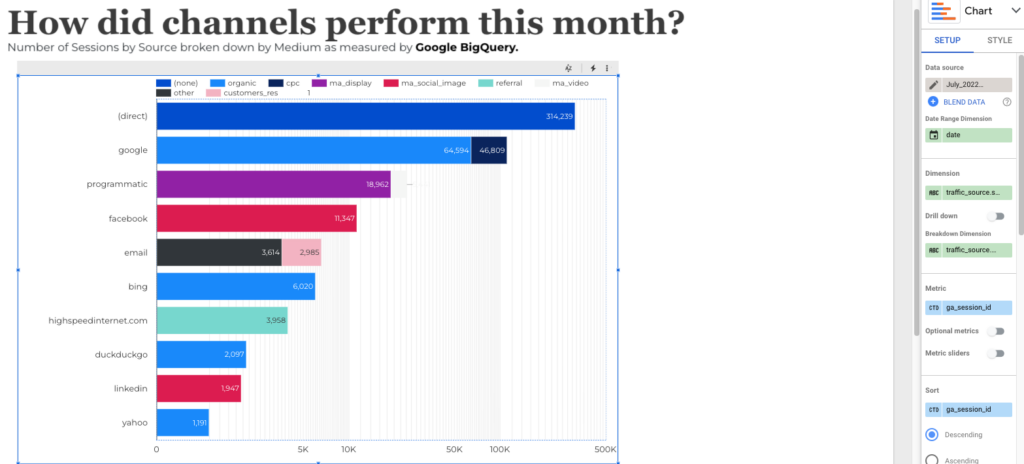
Once I did that, I turned my attention toward implementing some of the reports that were readily available in Universal Analytics. This article explores how and why we want to build three queries based on reporting needs. After we query, we can then make them into a table and pipe the data into Google Data Studio.
Queries to Improve Your GA4 Report
With the direct connector to GDS, we want to explore 3 queries based on some of the reports that were more readily available from Universal Analytics.
Each Google Analytics 4 property has a single dataset named “analytics_<property_id>” is added to your BigQuery project. Within each dataset, a table named events_YYYYMMDD is created each day if the Daily export option is enabled. I highly recommend enabling the daily export option. Once exported, you can find a list of all available columns in the GA4 BigQuery Export schema.
1. How to Create a BigQuery Table
Any query in BigQuery can be turned into a table. That table can then serve as your data source in a Google Data Studio report. Visit Google’s documentation for more details on how to create a table in BigQuery.
After the query is run, click on the “Save Results” drop-down in the Query Results section. You will have 7 options available. Choose the one named BigQuery table to then serve as a standalone table.

2. Build GA4 Fundamentals Into Your Table
One of the biggest challenges I faced when shifting over to GA4 was cardinality. Cardinality is the number of unique values assigned to a dimension. Invariably, I would receive the warning that “Google Analytics will only display the data in the cards when the data meets the minimum aggregation thresholds.” Cardinality often happens with URLs that have many different parameters associated with them.
BIgQuery to the rescue!
The workaround to this is a highly targeted, full sample of the bread and butter analytics that we know and love. Here’s the script I use:
SELECT
 user_pseudo_id,
 event_timestamp,

 (SELECT value.int_value FROM UNNEST(event_params) WHERE key = 'ga_session_id') AS ga_session_id,
 (SELECT value.string_value FROM UNNEST(event_params) WHERE key = 'page_location')
   AS page_location,
 (SELECT value.string_value FROM UNNEST(event_params) WHERE key = 'page_title') AS page_title,
 traffic_source
FROM
`mytable.events_*`
WHERE
 event_name = 'page_view'
ORDER BY
 user_pseudo_id,
 ga_session_id,
 event_timestamp ASC;
This delivers the following:
- A timestamped list of all users and sessions
- With a list of all pageviews
- By the source/medium

If you don’t have a CRM-based User ID available, include the user pseudo ID for now.
Any query in BigQuery can be turned into a table. That table can then serve as your data source in a Google Data Studio report.
Note that I have a direct connection to the table itself, not the entire database of GA data.
3. How To Build a Closed Loop Analytics Dataset via Custom Dimension
At Portent, we are big fans of Closed Loop analytics. Setting a non-PII (Personally Identifiable Information) User ID serves as a way to join the online and offline data sets together in the reporting layer. Our original post from 2019 walks you through each step in setting up a Custom Dimension.
Of course, we would set up our Random User ID (RUID) as a User-based-scope custom dimension.
After the RUID is set up, use the following script:
SELECT
 (select value.string_value FROM UNNEST(event_params) WHERE key = 'ruid') as RUID,
 event_timestamp,
 (SELECT value.int_value FROM UNNEST(event_params) WHERE key = 'ga_session_id') AS ga_session_id,
 (SELECT value.string_value FROM UNNEST(event_params) WHERE key = 'page_location')
   AS page_location,
 (SELECT value.string_value FROM UNNEST(event_params) WHERE key = 'page_title') AS page_title,
 traffic_source
FROM
`mytable.events_*`
WHERE
 event_name = 'page_view'
ORDER BY
 user_pseudo_id,
 ga_session_id,
 event_timestamp ASC;
We must also pass the RUID into our CRM of choice. Make sure that, in your CRM, you have two important factors in place:
- Lead scoring/Qualification exists
- Form customization is possible
From there, you’ll want to blend your two data sources – the BigQuery table and the CRM data. You might want to import a subset of your CRM data into Google Sheets. Some sample fields that you can use for this subset are:
- RUID
- Create Date
- Lead Scoring Value
- Lifecycle Stage

Wow, that’s a lot of data!
Wrap-Up
This data, blended with a full list of page visits and events, provides a scalable, manageable, and powerful method of analyzing user journeys throughout the entire customer lifecycle.
Your business requirements will dictate each of the data points that you want to measure. Your audience requirements will guide how you want to display that data. Unsampled Google Analytics data aligned with your CRM data provide rich veins of customer behavior both online and offline. Mining the insight is now in your capable hands!


