
As we move into the new year with talks of a recession on everyone’s tongue, marketing budgets being slashed, and tech layoffs happening left and right, it’s important that we take stock, take a deep breath, and hedge our bets as digital analysts collecting data.
For those of us who have been in this business long enough, we’ve been through worse: The Great Recession between 2007 and 2009. If we learned anything back then, we know it’s more important than ever for our clients and their companies to make smart decisions informed by trustworthy numbers.
Let’s get into some practical things we can do to batten down the data hatches and survive whatever 2023 brings to our digital marketing efforts.
1. Consider Alternatives to Google Analytics 4 (GA4)
Last year, I advised folks to lean into GA4 and adopt it. This year, we ought to find an insurance policy as a collective industry.
Between GA4’s shortcomings (which I documented in my glorified GA4 wishlist last month) and Google postponing the sunsetting of Universal Analytics until 2024 due to slow enterprise adoption, organizations are getting nervous about Google’s ability to right their flagship analytics product.
Our clients have taken to Matomo, which preserves a lot of what folks liked about UA in an open-source package. But there are other alternatives out there, which I mentioned and vetted in my post from a few years back: Should You Use More Than One Analytics Platform? The answer is yes. Yes, you should.
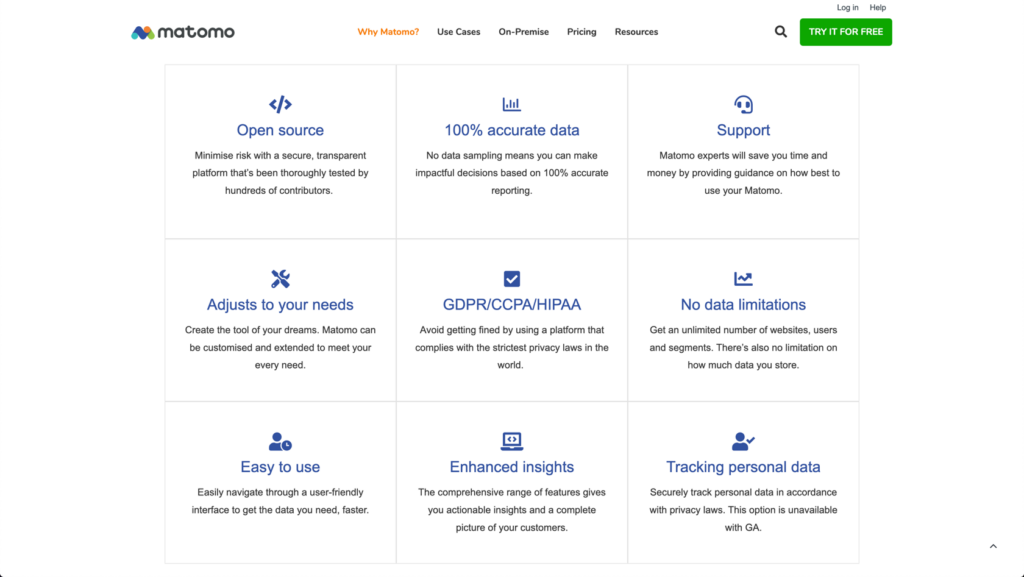
Source: Matomo.org
2. Spruce Up Automated Report Templates
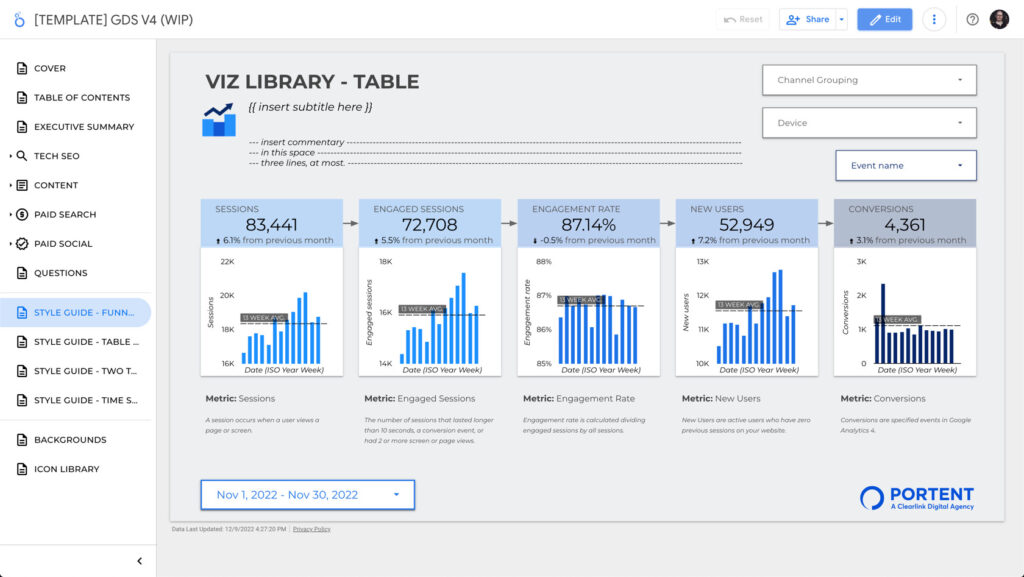
This year, my team executed internal and external surveys about our automated reporting templates and how they’re presented. We distilled what we learned in that process and came up with a shiny new template that we’ll pilot for our clients in 2023.
A few themes that came up from our surveys that informed the new design:
- It needed to be easy for multiple stakeholders to contribute to an executive summary
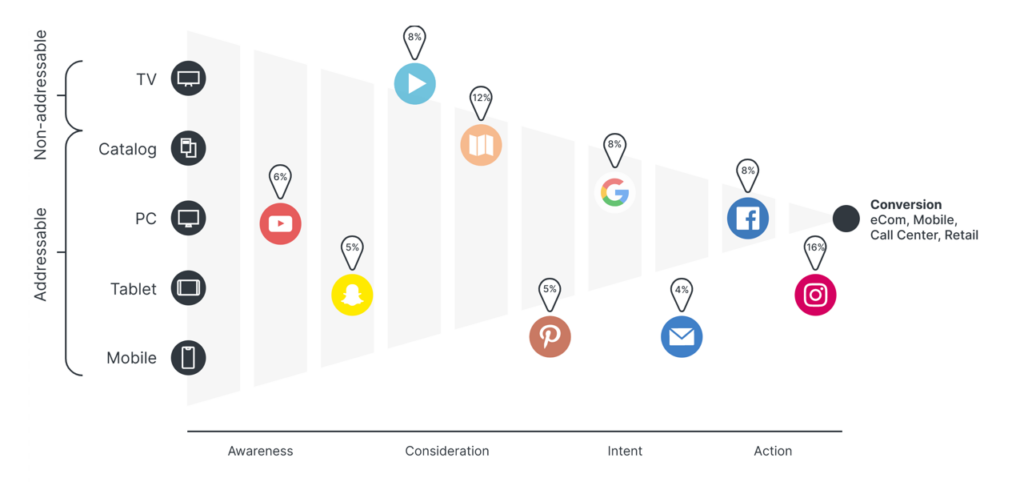
- It needed to present data in terms of marketing funnels and user journeys
- It needed to make confusing metrics plain and simple to understand
- It needed to be organized in a way that people new to the report could find what they wanted quickly
Those were our north stars in creating the new report template and governed every decision we made around it. We couldn’t be more excited about rolling this out.
If you’re looking to begin a similar process of improving your reports, start with this post about building report templates that stand the test of time. There’s also a great resource from our founder and former CEO, Ian Lurie, on using progressive detail in reporting.
3. Learn How to Use Incrementality
The ultimate “I dare you” in digital marketing used to be performing a hold-out test. Historically, it was hard to tell how a campaign impacted your whole marketing mix unless you shut it off and did a pre- and post-analysis.
Now, there are a number of amazing tools that will help you understand the incremental value of campaigns you have in flight without pulling them out of the market.
We’ve demoed tools like Measured this year, which has slick audience-split and geo-matched testing capabilities.
Source: Measured Experiment
When marketing budgets are tighter than ever, answering the question, “How many of these conversions would I have gotten if the campaign wasn’t running?” might save your spending allocation for the next quarter.
4. Creatively Enrich Your First-Party Data
Many of our clients are adopting tools like 6sense that can detect which companies are visiting your website, how close they are to your ideal buyer profile, and what stage of their buying cycle they might be in currently.
Layering this information on top of your web analytics data will supercharge your account-based marketing efforts. You’ll start to understand how often target companies participate in micro conversions and what kinds of content they’re reading at which stages in their customer journey.
Here’s an example of a report we put together for a client combining 6sense and Google Analytics data.
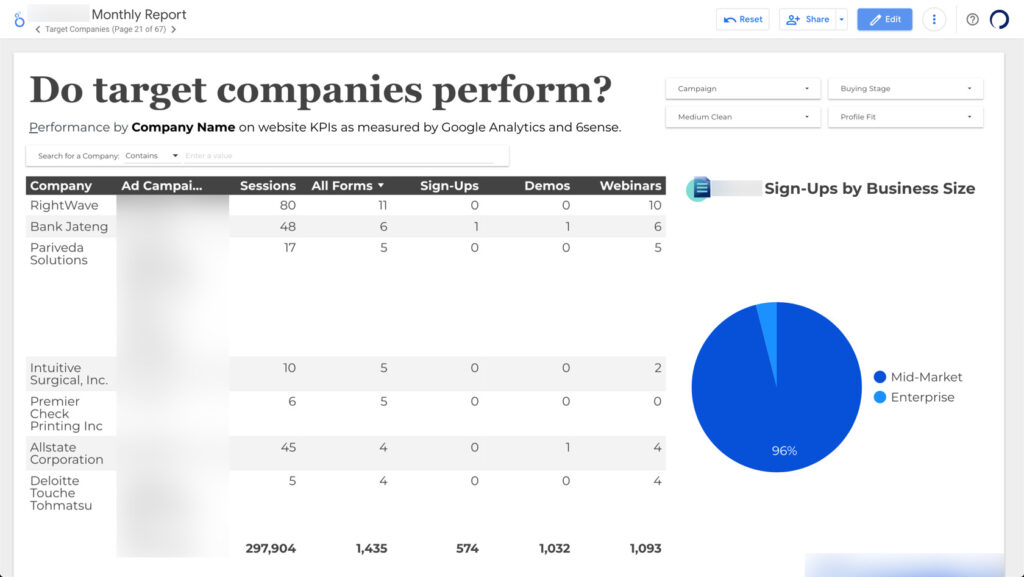
What’s great is that none of this data requires a form fill on your site to work! You can capture this just by virtue of people browsing. You can also export retargeting lists from 6sense into paid search and social platforms like Google Ads, Facebook, and LinkedIn to reach these accounts more readily.
5. Warehouse Everything You Can
Cloud database solutions like Amazon Redshift, Google BigQuery, and Microsoft Azure Synapse Analytics have made it incredibly easy to store data from a myriad of sources and connect to it from any BI tool on the market.
There are also great middleware ETL tools like SuperMetrics for BigQuery, which we recently purchased as an agency. These tools are no-code methods for connecting to the APIs of ad platforms, social media platforms, and web analytics platforms and sending them into a repository that you can query with common SQL or sit any data visualization tool on top of it.
Not only will this improve the load times in your aforementioned automated reports, but it will allow for centralizing data from disparate sources into one easily accessible place.
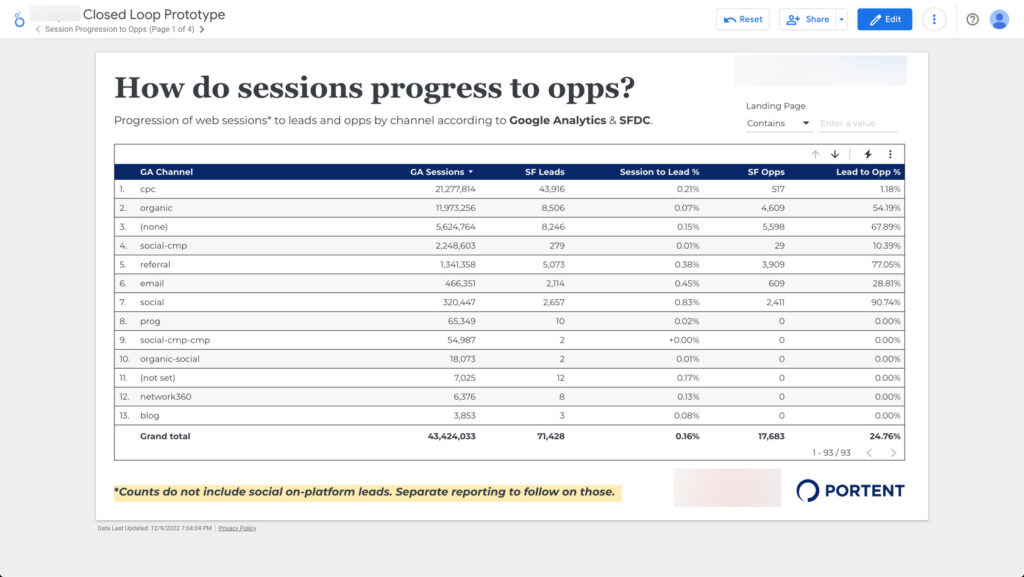
Lately, we’ve been helping clients tie together Salesforce and Google Analytics data using BigQuery, and the insights you can get from it are game-changing.
Good Luck Out There!
This coming year promises to build on the business challenges started by the pandemic back in 2020. But you can stay one step ahead by sorting out the basics in your analytics approach and taking a few calculated risks in expanding your tech stack.


