
Most folks have Google Analytics (GA) installed on their websites these days. It’s easy to set up, user-friendly, and free!
But as businesses grow (and run into some of the data sampling limitations of GA), it’s natural to start questioning some things:
- Is the data in GA trustworthy?
- Is GA’s channel attribution accurate?
- Am I missing events that occur on my website/app?
- Are my GA traffic numbers inflated by spam?
That’s when you start exploring alternatives to Google Analytics, and there are plenty out there. But the aim shouldn’t be to switch platforms, rather corroborate data between them.
So the short answer to “Should I Use More Than One Analytics Platform?” is: Yes, absolutely.
The long answer is more nuanced. Analytics platforms all have their pros and cons: accuracy, integrations, usability, etc. And when it comes down to it, you should also be comparing any output from your analytics tool to your server log files.
This post will attempt to help you navigate the crowded analytics platform space and try some new platforms alongside GA.
Matomo
Matomo, formerly known as Piwik, has been around for a good long while. It’s one of the original Open Source analytics platforms, going back to 2007 (almost as long as Google Analytics, which started in 2005).

PROS: Users of Google Analytics won’t be very lost in the platform as many of its features mimic GA, from their segment builder to custom campaign tagging (pk_campaign vs. utm_campaign). It’s also free and unlimited, provided you can install it on your own server. Recently, Matomo has expanded to include a tag manager, similar to Google Tag Manager.
CONS: Unlike GA’s Secondary Dimension feature, which makes it easy to combine source and content combinations, Matomo reports are pretty well limited to one or the other, unless you build a grip of segments and swap them out often. Speaking of segments, you can only apply one segment at a time to any given report (where you can compare up to four at a time in GA).

Quantcast Measure
Quantcast Measure is another free analytics tool that has a load of audience and demographic reporting features.
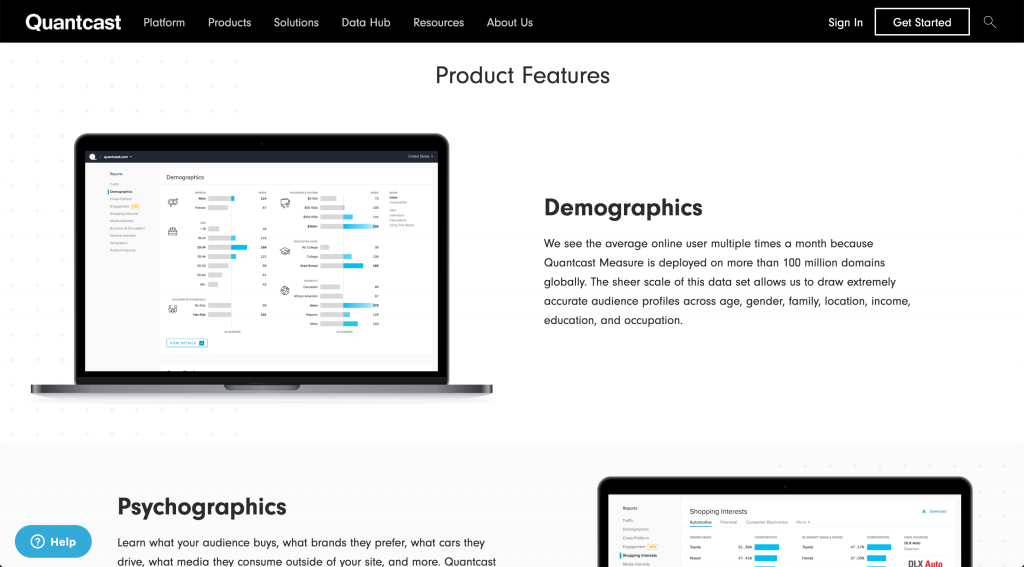
PROS: It has native support in Google Tag Manager. So all you need to do to install it is to copy your account number and paste it into GTM and publish it. Quantcast used to be a competitive analysis tool back in the day, so it excels at demographic, psychographic, and in-market interested around your site visitors, as well as benchmarking by industry.
CONS: Quantcast’s power is in its network of sites on the internet that have Measure installed. In exchange for all the information you get out of it, you’re giving competitors and other curious parties a direct window into your site’s performance.
Amplitude
Amplitude is an up-and-coming event-based analytics tool capable of measuring websites, apps (iOS and Android), and games (with a specific Unity integration).

PROS: Their free package is robust and supports unlimited users, data retention, and up to 10 million hits per month. This is more than ample for any small to mid-sized startup. They also have a slick integration with Slack to share visualizations quickly among pertinent teams.

On top of that, they have a cool feature that goes beyond GA’s annotation functionality allowing you to label and set date ranges for a product release or version and see how it affects the performance of your site or app.

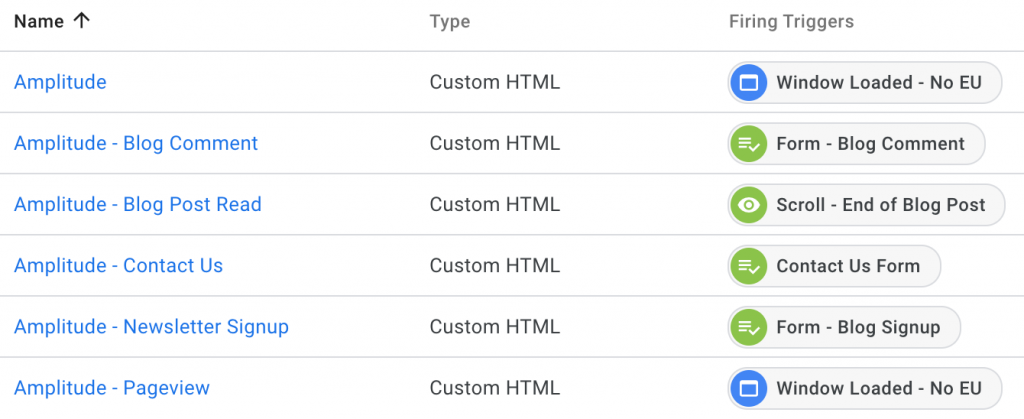
CONS: Setting up and deploying Amplitude through a tag manager was easy for me as somebody who is fairly technical. But since everything is dependent on events (including basic stats like website pageviews or app screen views), installing just their base JavaScript is fairly useless on its own. Marketers trying to get started with the tool may not understand that, as GA populates almost all reports right out of the box with no additional code configuration needed.
Here’s a look at how many tags I had to configure in GTM to get a basic understanding of how my website was working. That doesn’t include making sure the timing of the scripts was correct and that the base script was available before any events fired off.
Another hurdle to analyzing data in the tool is that there are no default dashboards that auto-populate with your events under the lens of common segments (e.g., geo, device). Charts need to be configured one-by-one and then placed into dashboards.
Heap
Heap is another growing player in the space that recently raised another $55M in VC funding.

PROS: One reason it’s been rising in popularity is its ability to name and report on events retroactively. The workflow for this process is amazing too! You can open up a visual of the website and highlight items you want event tracking on and label them in seconds.


Another benefit to Heap is that it’s uniquely set up to identify users, which is very useful for integrating data from CRMs and other information you might have outside of the web and app analytics world.
CONS: Just obtaining a trial from Heap was a pretty byzantine process. If your company ever had one in the past and you forgot about it, be prepared to have a lengthy back and forth email chain with their support. Beyond that, their “Free” and “Startup” plans are so limited (in terms of sessions and data retention) that it forces you into Enterprise before you really understand the potential power of the tool, let alone whether your business is ready for the burden of that level of cost.

The More, the Merrier
While you should be careful not to bog down your page load speed with too many unnecessary JavaScripts, having additional analytics tools installed alongside GA will help gut-check your pageview and session counts and give you different ways to analyze the performance of your audiences. Plus, you might enjoy some of the features that GA’s competitors are bringing to the table: their ability to ingest Personally Identifiable Information, easier event tracking configuration, and much more!


