Within content marketing, we’ve often used several engagement metrics to understand content engagement: time on page, scroll depth, link or button clicks, and so on. With GA4, there’s a new metric called engagement rate, giving us one holistic metric to summarize user engagement on a page or site.
What Is Engagement Rate in GA4 & Why Is It Important?
Engagement rate in GA4 is the percentage of engaged sessions on your website or mobile app. Google defines an engaged session as “a session that lasts longer than 10 seconds, has a conversion event, or has at least 2 pageviews or screenviews.” To calculate it, divide the number of engaged sessions by the total number of sessions.
Engagement rates help us understand how effectively a page or website captures and retains user interest, which is crucial for measuring content effectiveness and refining content strategy and user experience. Engagement rate is also an early indicator of conversions and revenue—the more people engage with your page or website, the more likely they are to convert.
How to Find Engagement Rate in GA4
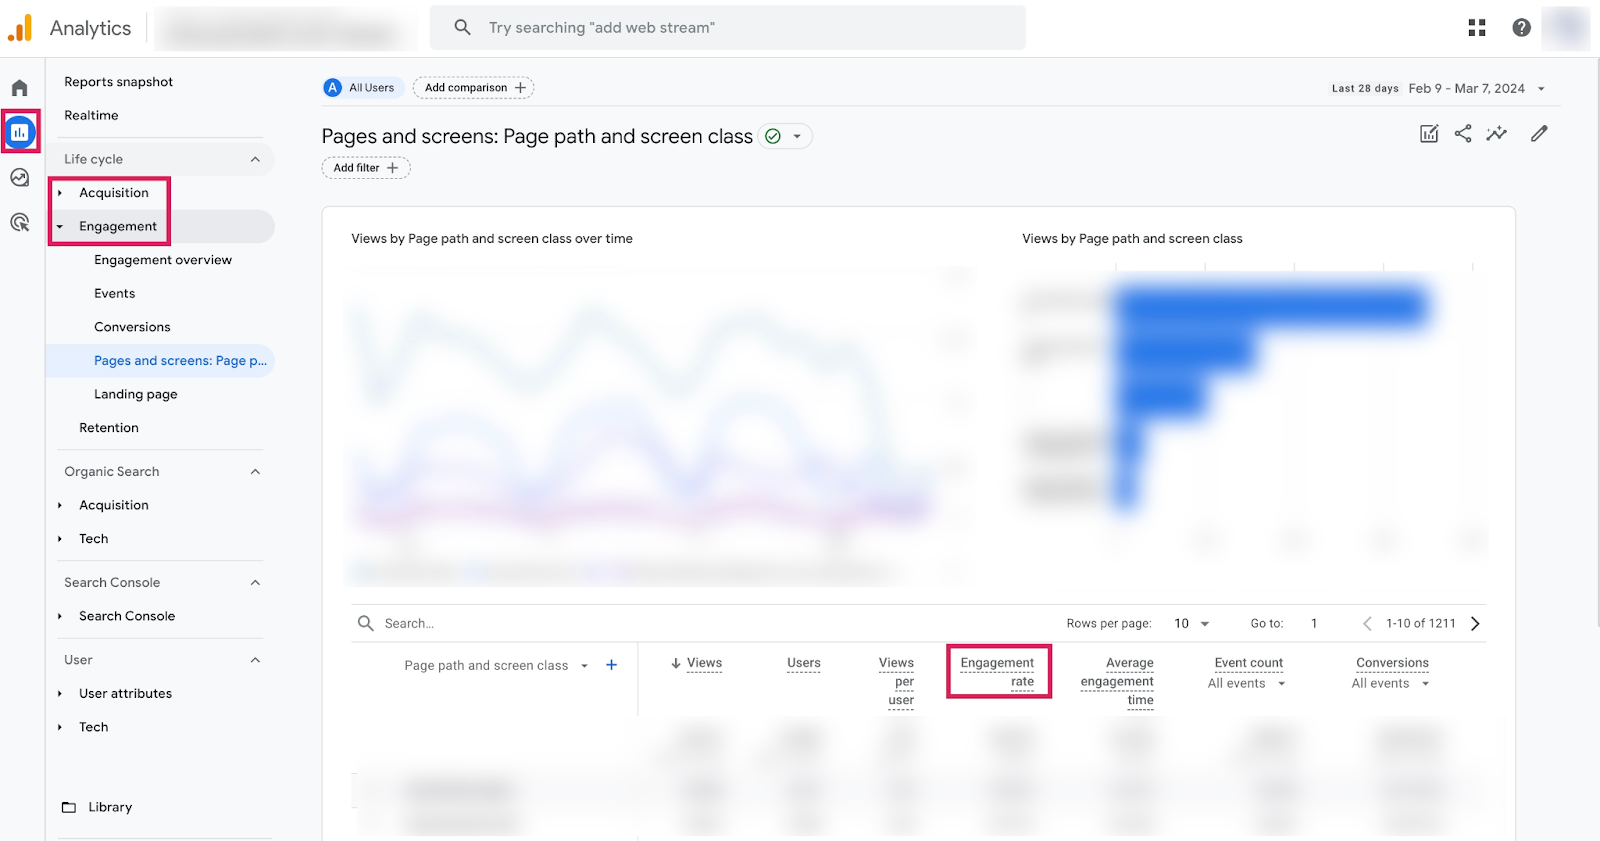
You can find engagement rate data using the Acquisition or Engagement reports in GA4. If you don’t see the engagement rate metric within the data table, you will need to customize the report to add it.
Engagement Rate vs. Bounce Rate
The engagement rate is calculated by taking the number of engaged sessions and dividing that by the total number of sessions. The bounce rate is the inverse—it’s calculated by taking the number of unengaged sessions and dividing that by the total number of sessions.
While engagement rate measures the quality of user interactions, bounce rate tracks sessions where the user leaves without interacting. A high engagement rate is a positive sign of compelling content, whereas a high bounce rate can indicate issues with content relevance or site usability.
Since the two GA4 metrics are opposites of each other, you can rely on one metric while still understanding the other. However, if you have a pointed question to answer, it may be more suitable to use one metric over the other. For example, “Which content formats or topics drive more engagement?” is better answered using engagement rate. On the other hand, “Are certain pages less effective in capturing user interest?” is better answered using bounce rate.
When to Use Engagement Rate vs. Other Types of Engagement Metrics
Use engagement rate for a holistic view of the quality of user interactions with a page or website—it’s most effective when assessing the overall quality of content and user experience. In contrast, other metrics like session duration, time on page, or page views are more suitable for specific insights, such as level of user interest and content depth.
What Is a Good Engagement Rate in GA4?
A “good” engagement rate in GA4 varies by industry and content type. Benchmarking against industry standards is important to set realistic goals and measure performance effectively.
To provide benchmarks, we studied the GA4 engagement rates across 65 websites in 2023.
Average Engagement Rate
The average engagement rate across industries and company types is 62%.
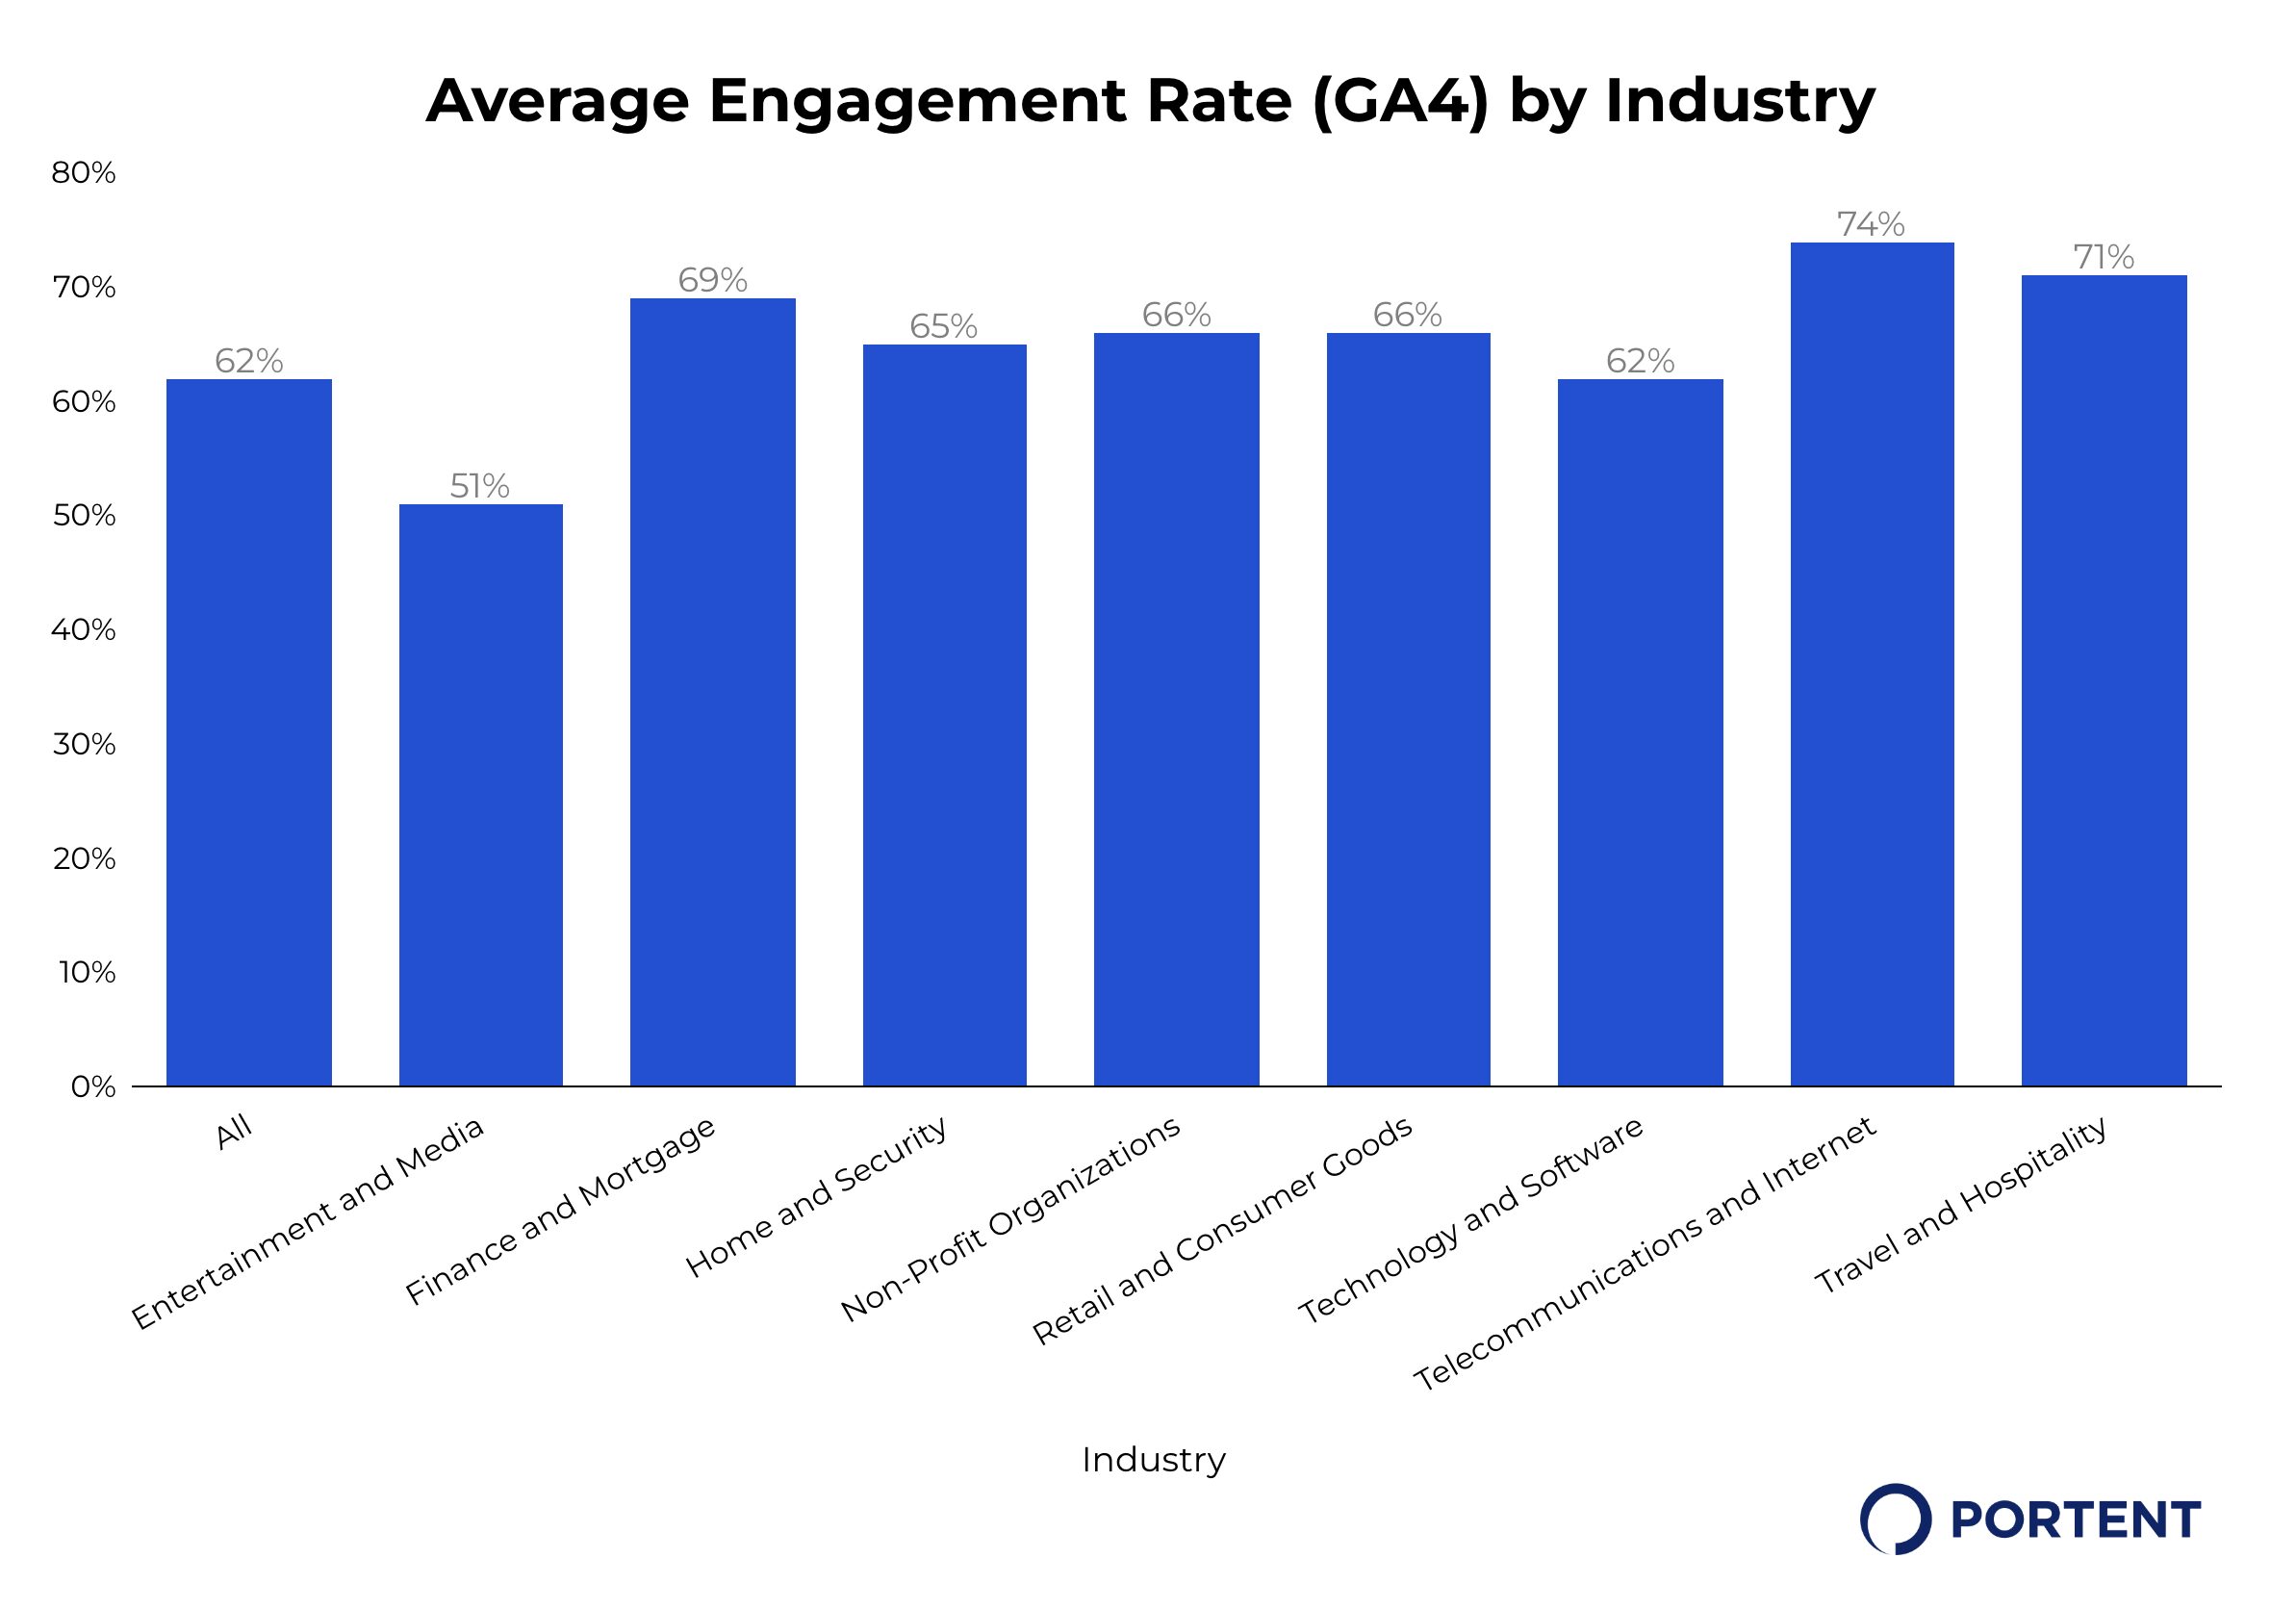
Engagement Rates by Industry
| Industry | Average Engagement Rate |
| All | 62% |
| Entertainment and Media | 51% |
| Finance and Mortgage | 69% |
| Home and Security | 65% |
| Non-Profit Organizations | 66% |
| Retail and Consumer Goods | 66% |
| Technology and Software | 62% |
| Telecommunications and Internet | 74% |
| Travel and Hospitality | 71% |
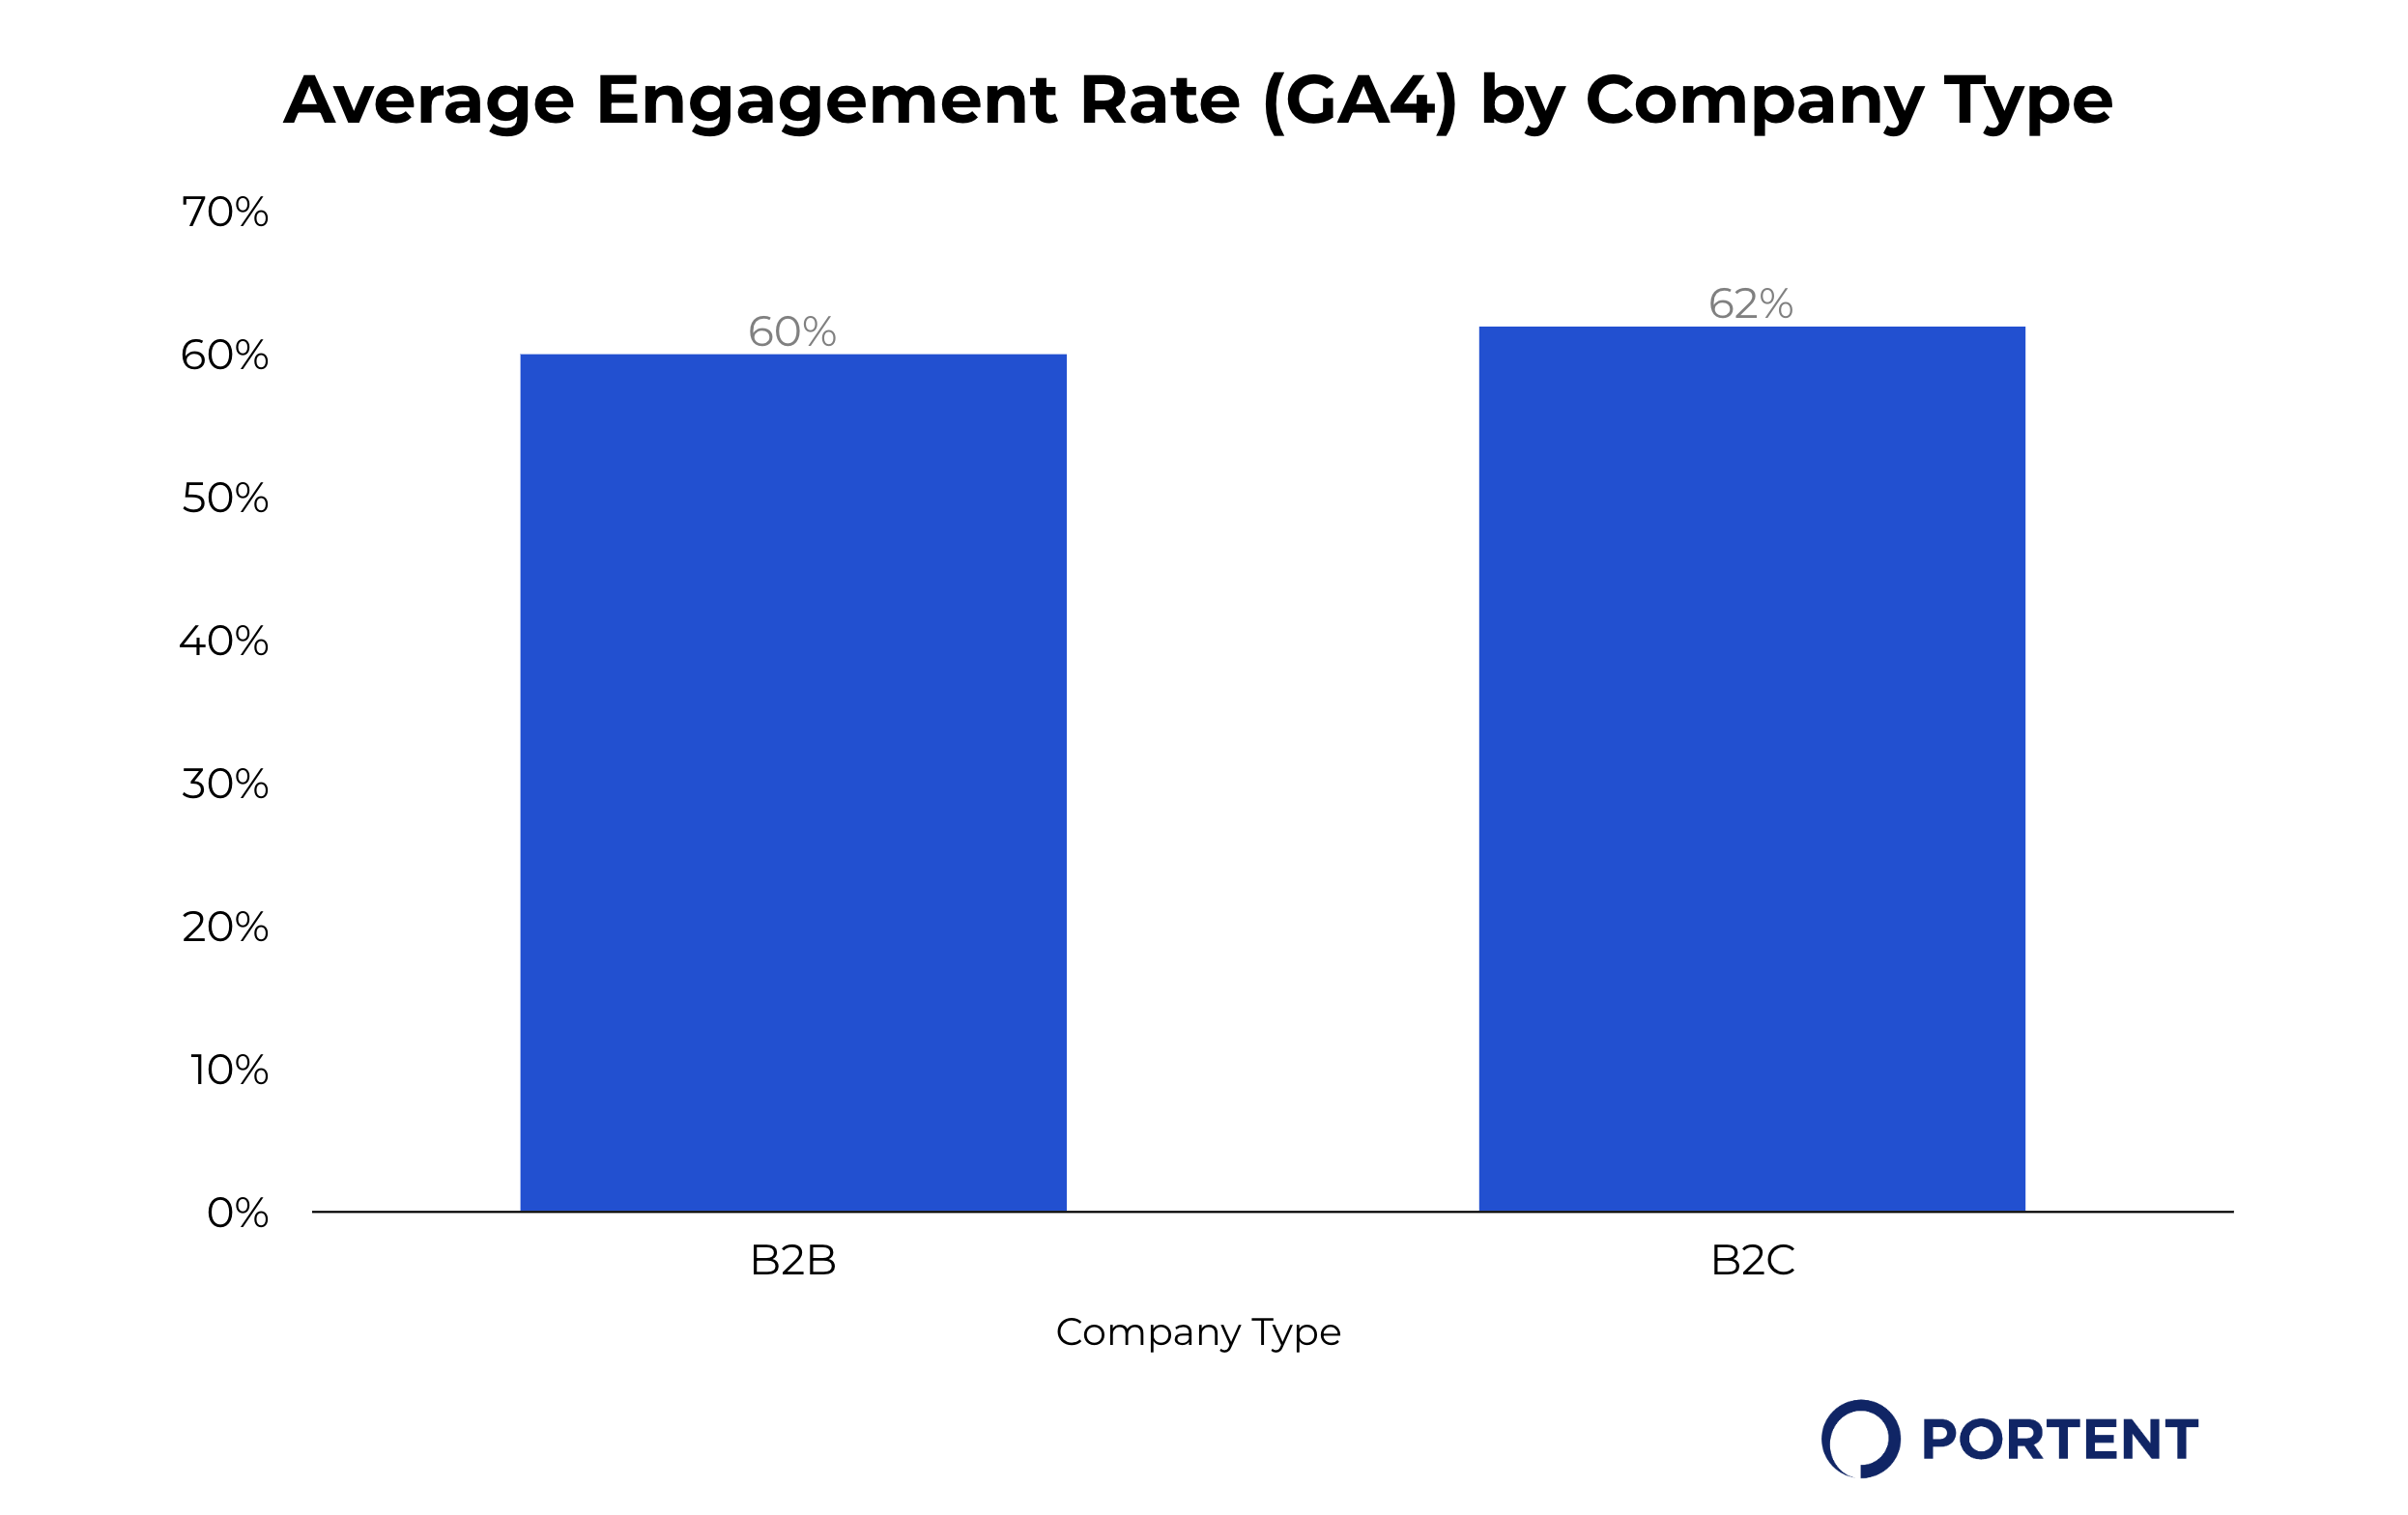
Engagement Rates by Company Type
| Industry | Average Engagement Rate |
| B2B | 60% |
| B2C | 62% |
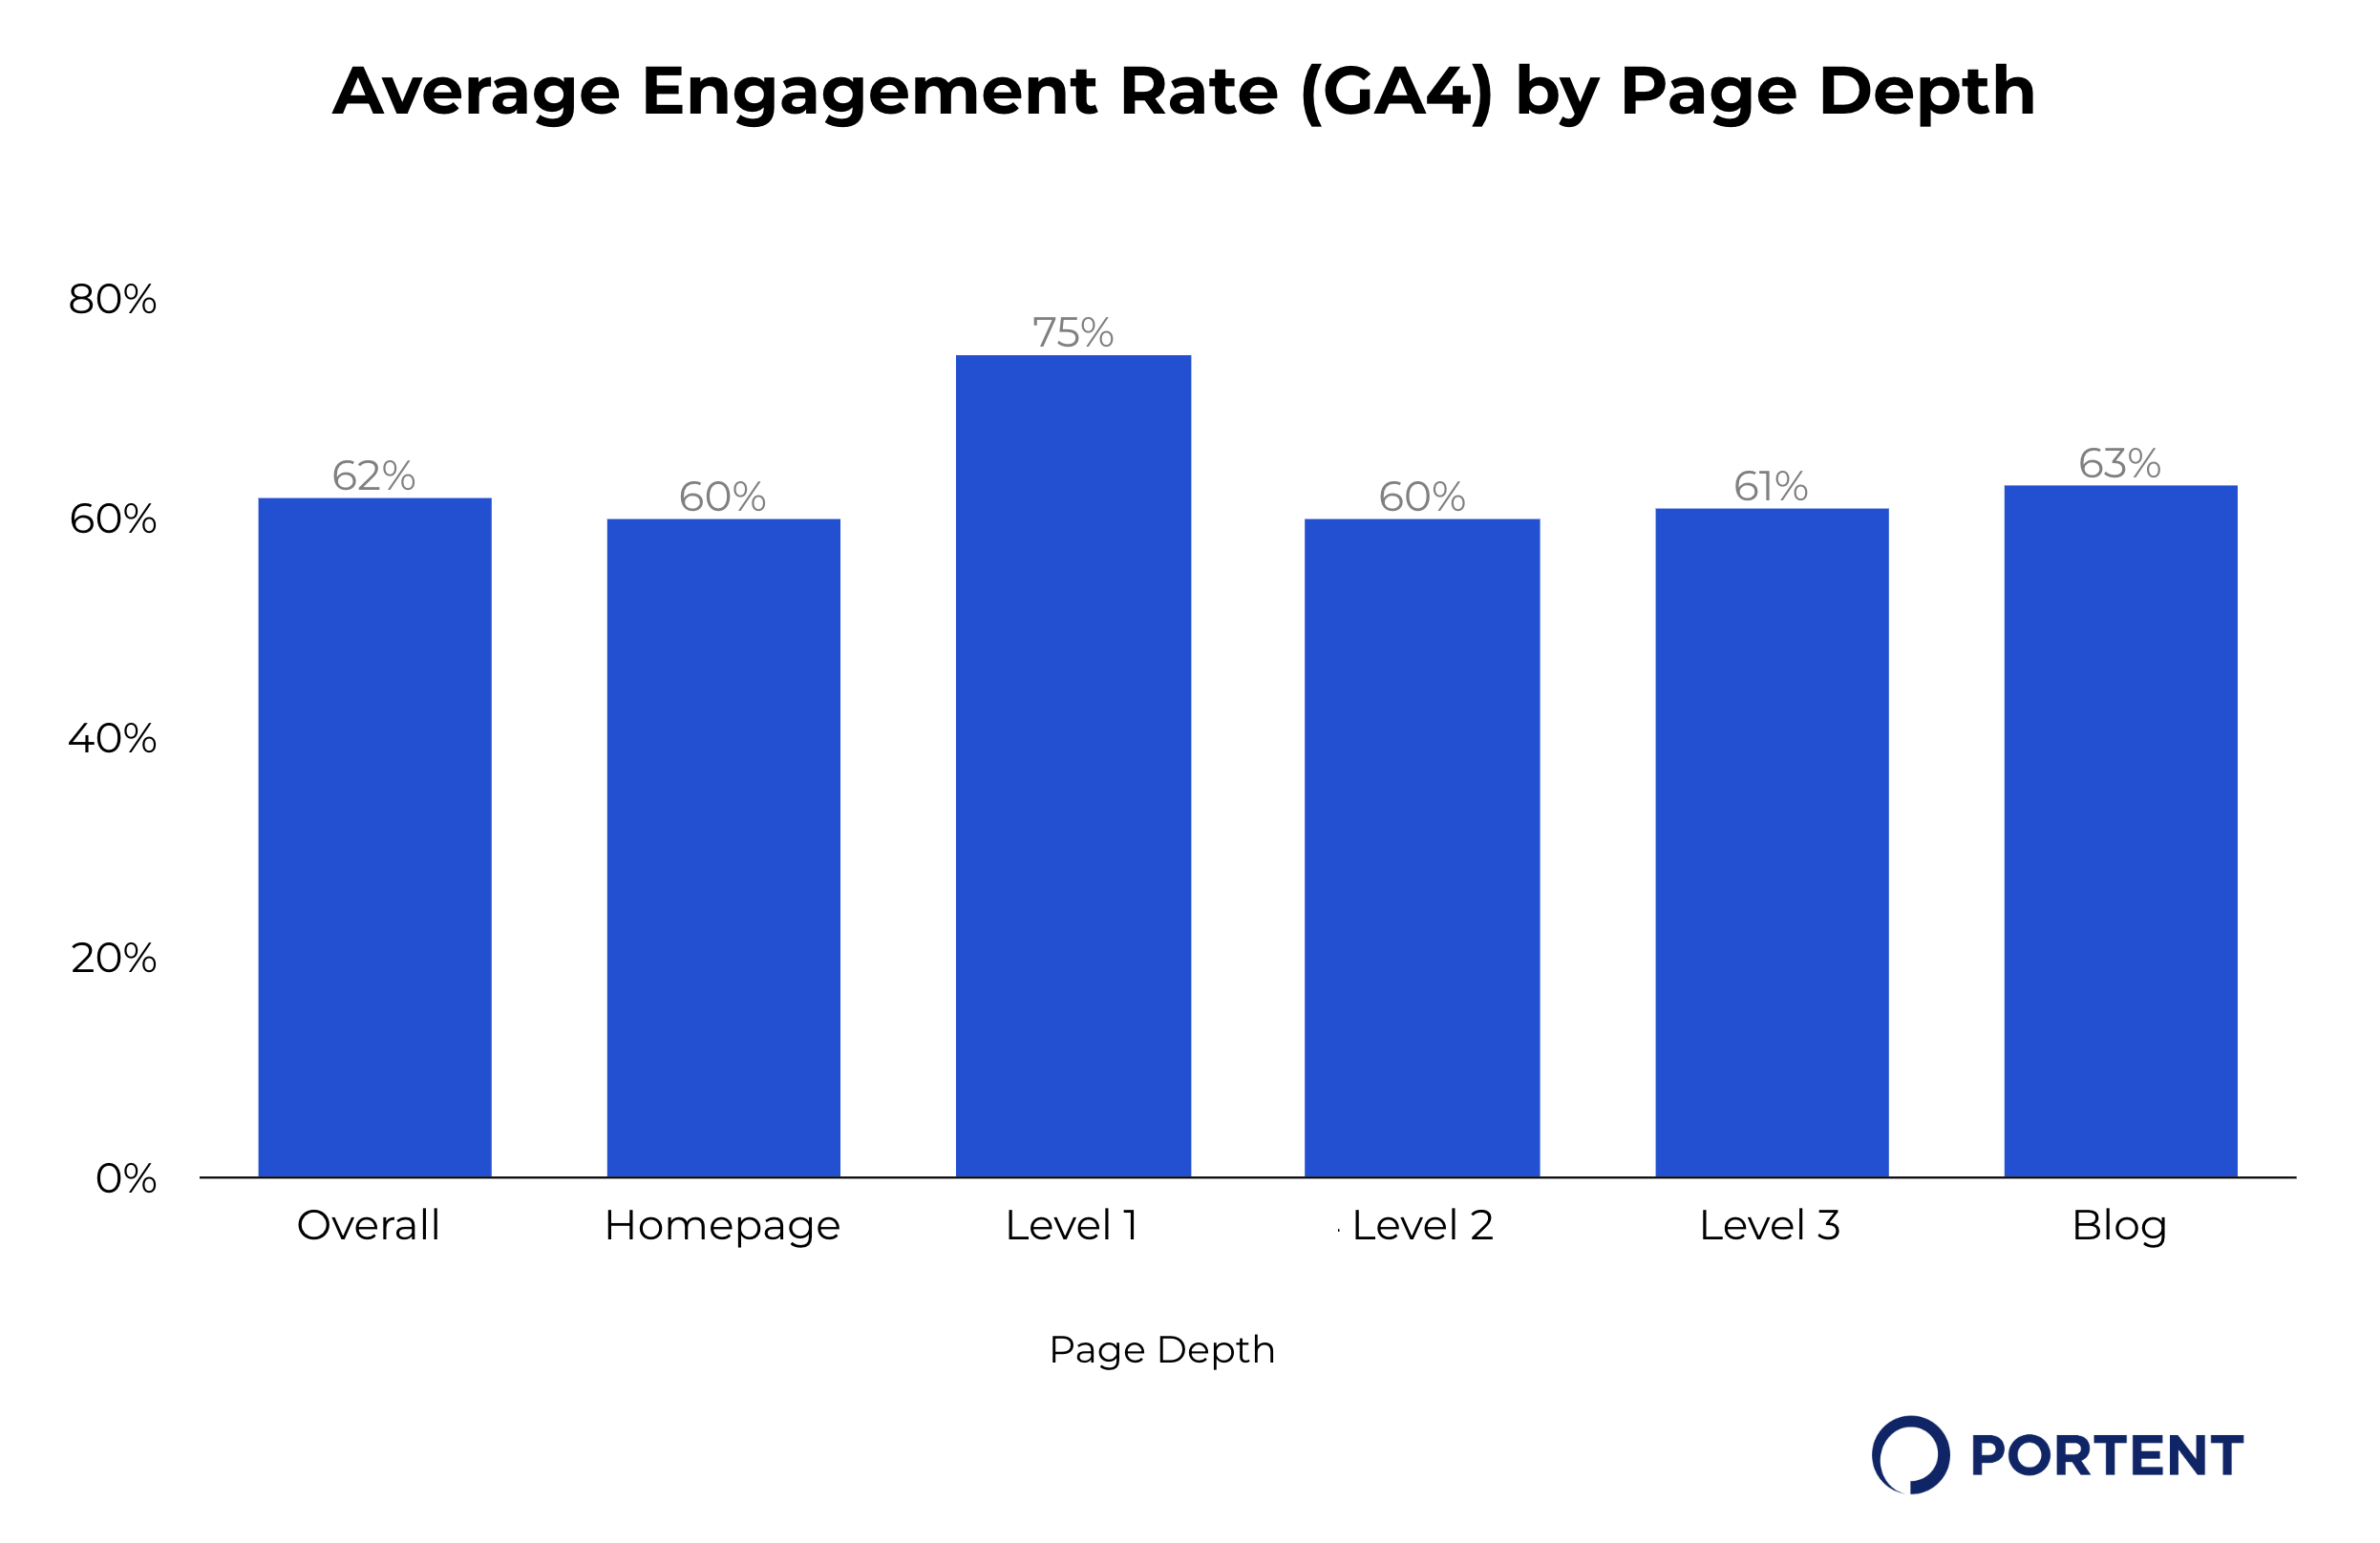
Engagement Rates by Page Depth
| Industry | Average Engagement Rate |
| All | Overall average: 62% Homepage: 60% Level 1: 75% Level 2: 60% Level 3: 61% Blog: 63% |
| Entertainment and Media | Overall average: 51% Homepage: 37% Level 1: 39% Level 2: 59% Level 3: 45% Blog: 59% |
| Finance and Mortgage | Overall average: 69% Homepage: 61% Level 1: 61% Level 2: 59% Level 3: 77% Blog: 64% |
| Home and Security | Overall average: 65% Homepage: 60% Level 1: 69% Level 2: 64% Level 3: 63% Blog: 65% |
| Non-Profit Organizations | Overall average: 66% Homepage: 67% Level 1: 53% Level 2: 56% Level 3: 76% Blog: 54% |
| Retail and Consumer Goods | Overall average: 66% Homepage: 74% Level 1: 83% Level 2: 62% Level 3: 63% Blog: 65% |
| Technology and Software | Overall average: 62% Homepage: 57% Level 1: 60% Level 2: 61% Level 3: 58% Blog: 64% |
| Telecommunications and Internet | Overall average: 74% Homepage: 56% Level 1: 64% Level 2: 78% Level 3: 69% Blog: 43% |
| Travel and Hospitality | Overall average: 71% Homepage: 68% Level 1: 64% Level 2: 76% Level 3: 67% Blog: 63% |
How to Increase Your Engagement Rate
Given the definition of an engaged session, you’ll want to focus on increasing time on a page or site, the conversion rate on a page or site, and pages per session. There are various aspects to optimize, and the priority of each will depend on the purpose of your page or website, your target audience’s preferences, results of historical efforts, and implementation resources, to name a few.
Create Relevant & Engaging Content
Create content that’s relevant and worthy of engagement; that means developing informative and helpful content for your target audience’s interests and needs.
- Start your content creation efforts by identifying your target audience and the questions they have at various stages of their buyer’s journey.
- Ensure your content has sufficient depth by addressing your target audience’s goals or questions and with the right level of information.
- Create content in various formats, such as images, videos, infographics, and polls, and incorporate them throughout a page to encourage users to stay on the page for longer.
- Create various content types such as guides, blogs, reports, webinars, case studies, etc.
- Link to this relevant content throughout other pages on the site and within a “Related Resources” section to view additional content.
- Where appropriate, utilize CTA buttons to emphasize the desired action you want your users to take.
Optimize Readability & Scannability of Content
Readability and scannability of content can keep your users focused on the content in front of them so they stay on the page longer.
- Use clear and concise language.
- Structure your content with distinct headings, bullet points, and white space for easy browsing.
- Incorporate visuals like images or videos to break up text and highlight key information using bold or italics to draw attention.
Enhance User Experience
A good and frictionless user experience allows users to browse content, find information, visit other parts of your website, and easily complete their intended tasks. Optimizing user experience on your website can translate to a meaningful increase in time on page/site, pages per session, and conversion rates.
- Use clear, descriptive labels for navigation and organize content logically.
- Ensure your website is responsive and offers a smooth experience across all devices.
- If your page includes a form, keep your forms as simple as possible.
- Provide clear field labels and error messages to help users correct mistakes.
- Remove any unnecessary form fields to simplify the form completion process.
- Use action-oriented and descriptive CTAs and link anchor text that describes what happens after a user clicks it.
- Also, use CTA and link colors that stand out while still being easy on the eyes. Test your colors using WebAIM’s contrast checker.
Optimize Site Speed
Slow loading times can lead to frustration and cause users to leave your site, which will impact your engagement rates, bounce rates, conversion rates (check out our study on how site speed impacts conversion rates), and other digital marketing metrics (check out our blog post on why page speed matters).
On the other hand, adequate loading times will allow users to browse and interact with your website easily.
- Optimize image file sizes by compressing images.
- Reduce the number of plugins and third-party scripts.
- Minimize the number of redirects for a page.
For more ideas, check out the web development checklist for maintaining page speed.
Wrap Up
I hope this was a valuable resource for learning more about GA4’s engagement rate metric and a benchmark for what a good engagement rate is. Understanding and improving these rates are crucial steps towards boosting conversions, revenue, and overall business success.
But remember—measuring engagement is just one part of measuring content success. Check out our blog post on “Best Content Marketing KPIs and Metrics” to see what other KPIs and metrics you should track.
For those looking for additional training, evaluation of GA4 engagement metrics, or optimization of engagement, our team of Analytics and Content Strategy experts can help.