
User behavior analytics platform Hotjar defines rage clicks as moments, “when users repeatedly click (and click and click) in a certain area or on a specific element of your website over a short period of time.” UX and web designers recognize these behaviors as signals of frustration on websites and interfaces.
Our CRO team has recently explored and put into action a way to get rage click events to appear in our Google Analytics reports, be observable Hotjar recordings, and display a survey for visitors to provide feedback on what made their user experience frustrating. We’re proud to share this guide with you and your teams to use and iterate upon!
Why Should I Care About Rage Clicks?
Without tracking rage clicks, digital marketing strategists won’t have a way to identify when a page visitor becomes frustrated and takes it out with repeated clicks and taps on their devices. Try to recall the last time you repeatedly clicked or tapped on a page due to slow loading speeds or poorly designed interactive elements. Addressing and validating frustration are crucial steps toward improving the experiences on your page for visitors, users, or customers, thus improving your goal KPIs.
For example, rage clicks can also spotlight areas on your website where an interactive element may be useful! If enough visitors are trying to click on an image or text they want to learn more about, recorded rage click events can show designers exactly where they happen. These recordings also help strategists advocate to provide an interactive info button or link to a resource that may satisfy a visitor’s curiosity along the user journey.
Where Can I See Rage Clicks Happening On My Website?
There are numerous applications marketers and designers use to record, observe, and archive rage clicks occurrences. Portent CRO has recently found success in a combination of Hotjar, Google Analytics, and Google Tag Manager. All of these work harmoniously together to paint a clearer picture of where and how visitors to your pages are finding frustrations. As an added bonus, we’ll share how you can replicate our setup for your own research and optimizations!
Hotjar
Hotjar is a great place to start observing rage clicks as they happen on your website, and our tool of choice when integrating it with Google Analytics and Tag Manager (more on that, later!) UX designers and CRO strategists can identify rage clicks in anonymized records of visitors on websites, like the example below:

Google Analytics and Tag Manager
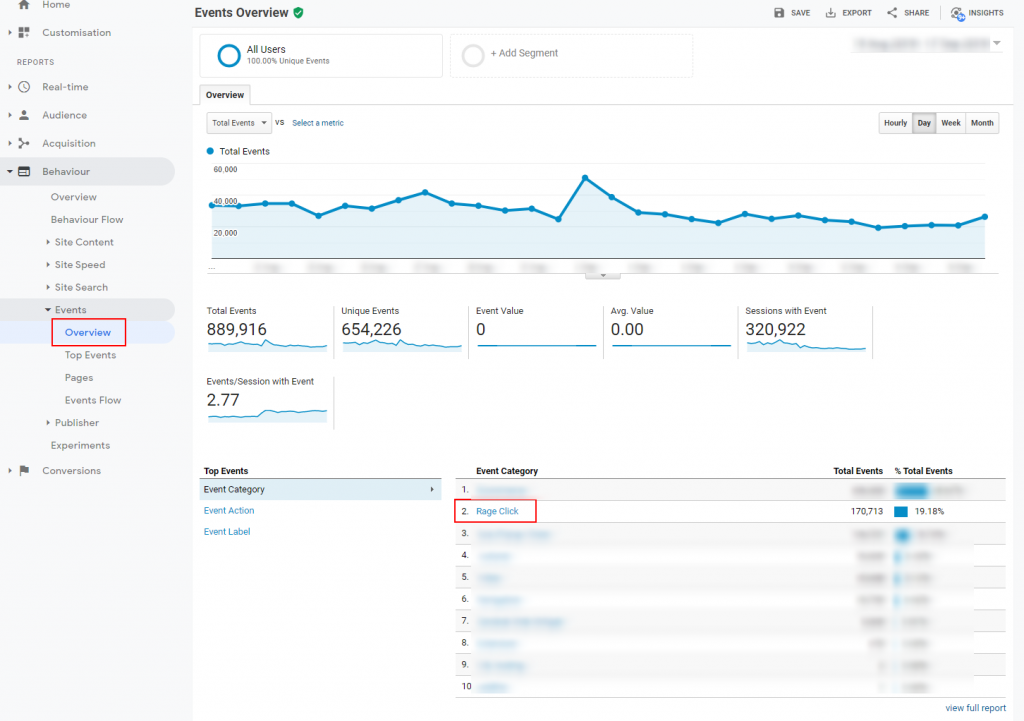
Analysts and strategists can rely on Google Analytics Events and Behavior reporting to highlight places on a website where actions like rage clicks happen and how often. By building custom event triggers and tags in Google Tag Manager, you can assign behaviors such as rage clicks to dimensions in your GA reporting.
How Can I Use Rage Clicks to My Advantage and Eliminate My Visitors’ Points of Frustration?
We’re going to have to get a bit technical here to show you how you can use a combination of Hotjar, Google Analytics, and Google Tag Manager to track and analyze your rage click custom events. Don’t worry, though. We’ll provide steps and resources to make sure this robust setup will work for you.
What Do I Need to Track Rage Clicks and Address Them?
With the following recipe for how to best track and respond to rage clicks, you can uncover these points of frustration that get in the way of user experience, customer satisfaction, and ultimately conversion rates on your pages.
Step 1: Hotjar (Plus or Business Plan)
Recording software like Hotjar all come at price tiers that enable you to record hundreds to thousands of sessions a week, but if you spring for the “Business” plan, you’ll have access to Hotjar’s native tools and filters that recognize rage clicks on the websites you manage. Once you have created your account, installing their software on your domain is outlined in Hotjar’s installation guide, or you can install Hotjar using Google Tag Manager to avoid needing a developer to hardcode it.
Step 2: Google Tag Manager and Custom HTML
Using your website domain’s Google Tag Manager account, you’ll want to start by creating a Custom HTML tag using the following code, which is available from Reflective Data:
<script>
if ( typeof(jQuery) === 'function' ) {
    jQuery(document).ready(function($) {
        jQuery.fn.extend({
            getPath: function() {
                var path, node = this;
                while (node.length) {
                    var realNode = node[0],
                        name = realNode.localName;
                    if (!name) break;
                    name = name.toLowerCase();
                    var parent = node.parent();
                    var sameTagSiblings = parent.children(name);
                    if (sameTagSiblings.length > 1) {
                        var allSiblings = parent.children();
                        var index = allSiblings.index(realNode) + 1;
                        if (index > 1) {
                            name += ':nth-child(' + index + ')';
                        }
                    }
                    path = name + (path ? '>' + path : '');
                    node = parent;
                }
                return path;
            }
        });
        // Number of rage clicks
        var no_of_clicks = 5;
        //Time interval - var time value is in seconds, for example 3 is for three seconds
        var time = 3;
        var click_events = [];
        //internal variables, referring to the number of possible clicks within a set radius of pixels
        var possible_click = 5;
        var radius = 100;
        function detectXClicks(count, interval) {
            var last = click_events.length - 1;
            var time_diff = (click_events[last].time.getTime() - click_events[last - count + 1].time.getTime()) / 1000;
            //returns false if it event period is longer than 5 sec
            if (time_diff > interval) return null;
            //check click distance
            var max_distance = 0;
            for (i = last - count + 1; i < last; i++) {
                for (j = i + 1; j <= last; j++) { var distance = Math.round(Math.sqrt(Math.pow(click_events[i].event.clientX - click_events[j].event.clientX, 2) + Math.pow(click_events[i].event.clientY - click_events[j].event.clientY, 2))); if (distance > max_distance) max_distance = distance;
                    if (distance > radius) return null;
                }
            }
            var result = {
                count: count,
                max_distance: max_distance,
                time_diff: time_diff
            }
            return result;
        }
        function removeUsedClickPoints(count) {
            click_events.splice(click_events.length - count, count);
        }
        $("body").click(function(event) {
            click_events.push({
                event: event,
                time: new Date()
            });
            //remain only required number of click events and remove left of them.
            if (click_events.length > possible_click) {
                click_events.splice(0, click_events.length - possible_click);
            }
            //detect 3 click in 5 sec
            if (click_events.length >= 3) {
                var result = detectXClicks(no_of_clicks, time);
                if (result != null) {
                    var path = $(event.target).getPath();
                    //console.log('Rage Click: ' + JSON.stringify(result));
                    dataLayer.push({
                        'event': 'rageclick',
                        'rc_element': path,
                        'rc_count': result.count,
                        'rc_max_distance': result.max_distance,
                        'rc_time_diff': result.time_diff
                    });
                    removeUsedClickPoints(3);
                }
            }
        });
    });
}
</script>
The purpose of this tag, once published, is to “listen” for rage clicks as visitors come and go throughout your website.
Next, you’ll want to set this tag’s Firing Trigger to Page Views on All Pages. Before you hit Save, your setup may look similar to this screenshot:

Something you’ll find towards the bottom of this script is a place where the name “rageclick” will be used as the event that will be pushed to the data layer. Keep this in mind for the remaining steps of the process.

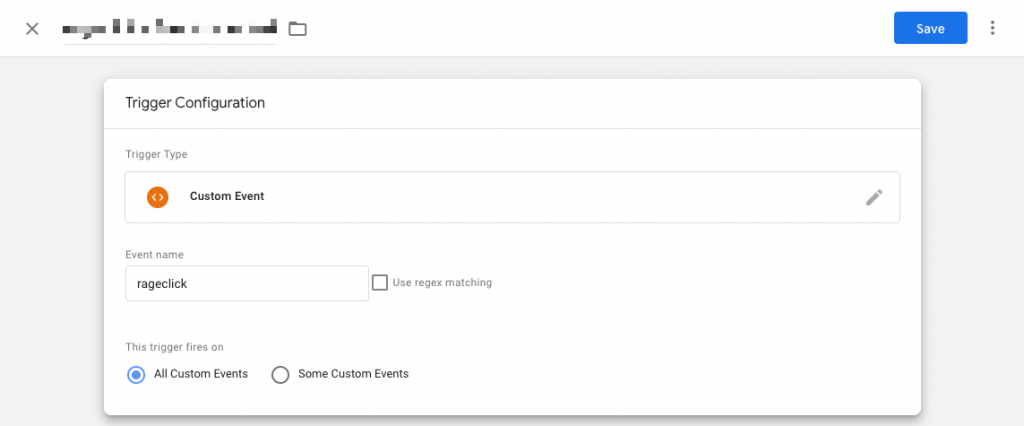
Step 3: Google Tag Manager and Custom Event Trigger
In this step, we’re going to create a trigger using a Custom Event. It’s important to use the same event name from the previous step, “rageclick.”
Step 4: Google Tag Manager and Tags for GA and Hotjar
It’s time to use the Trigger created in step 3 to add to both tags for your GA and Hotjar properties.
The tag type needed for Google Analytics will depend on the version of the platform you’re using. Here are examples of what I’ve spun up for Universal Analytics and GA4:


The GA4 Event tag allows you to set a parameter for your event name, similar to Universal Analytics’ use of Label. If you’re starting out, my recommendation is to use Page URL, but you can get as granular as including a Click Element!
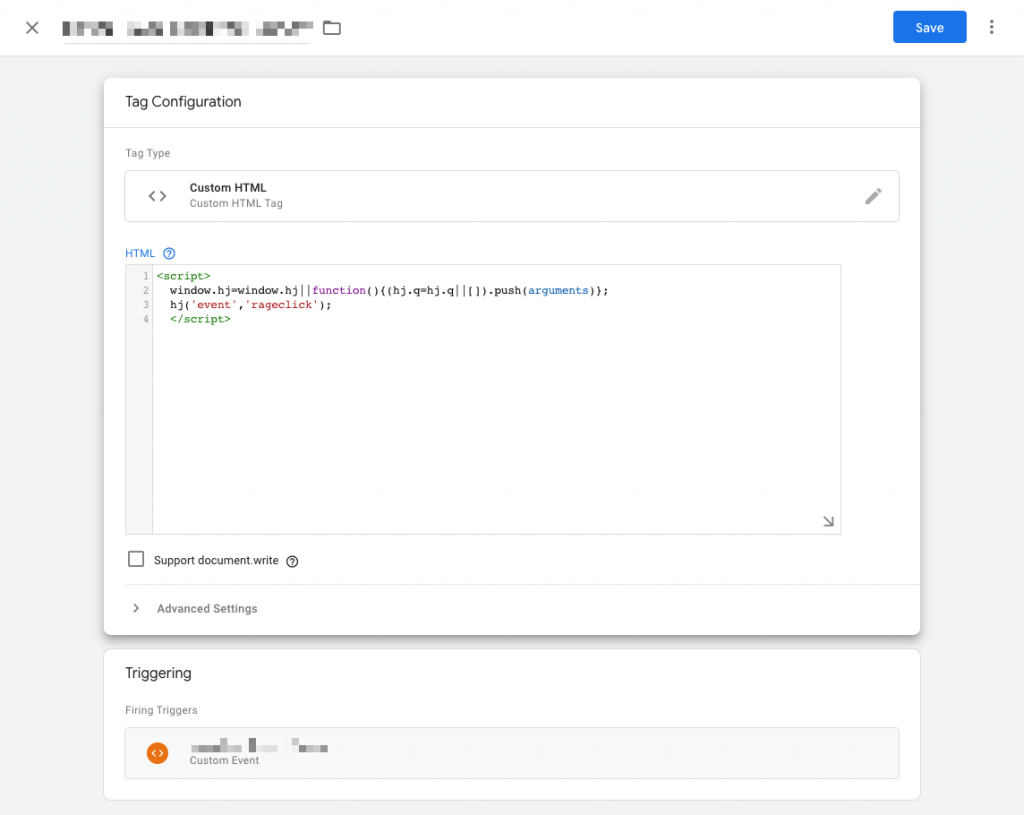
After you’ve added your trigger from step 3 and saved your GA tag of choice, you’ll want to create a Custom HTML tag for Hotjar. The script you’ll need for this is as follows:
<script>
  window.hj=window.hj||function(){(hj.q=hj.q||[]).push(arguments)};
  hj('event','rageclick');
</script>
Once you have that added in, your tag configuration will need your trigger from step 3 added in before hitting Save. Here’s an example of how this should look:
What Happens Next After I Set All of This Up?
Whew! Yes, that probably seemed like a lot, but you’re going to like what this will do for your Hotjar recordings and event tracking. Here’s what to expect next.
Hotjar Recordings and Event Targeting
Three major value-adds happen in your Hotjar Plus or Business accounts.
First, you’ll discover that you’ll have a new “Event” you can use when filtering recordings.

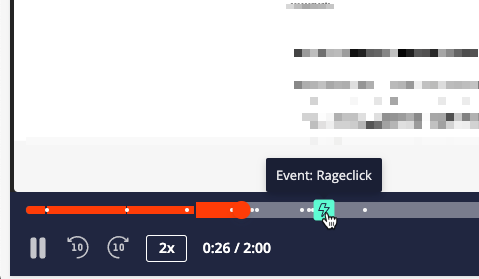
Secondly, within recordings, you’ll also see your custom “rageclick” event show up on the playback’s timeline.
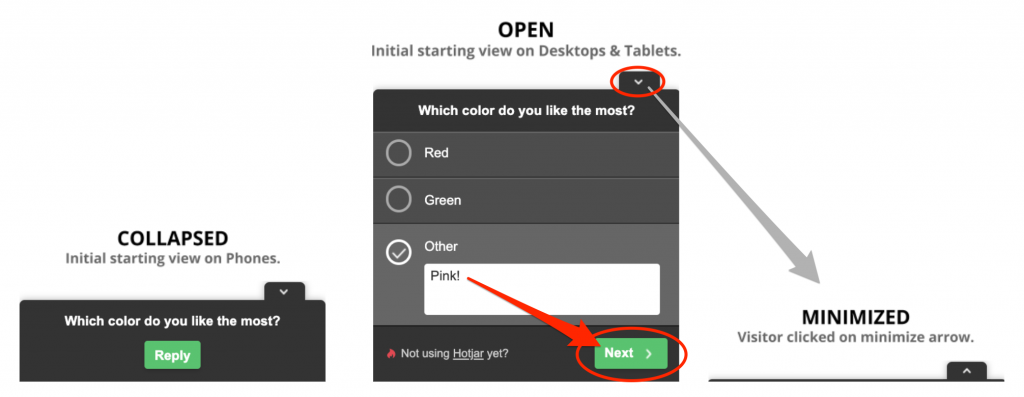
The third, and my favorite, allows you to use this “rageclick” event in popover surveys. Below is an example of how one appears on a website for visitors to interact with:
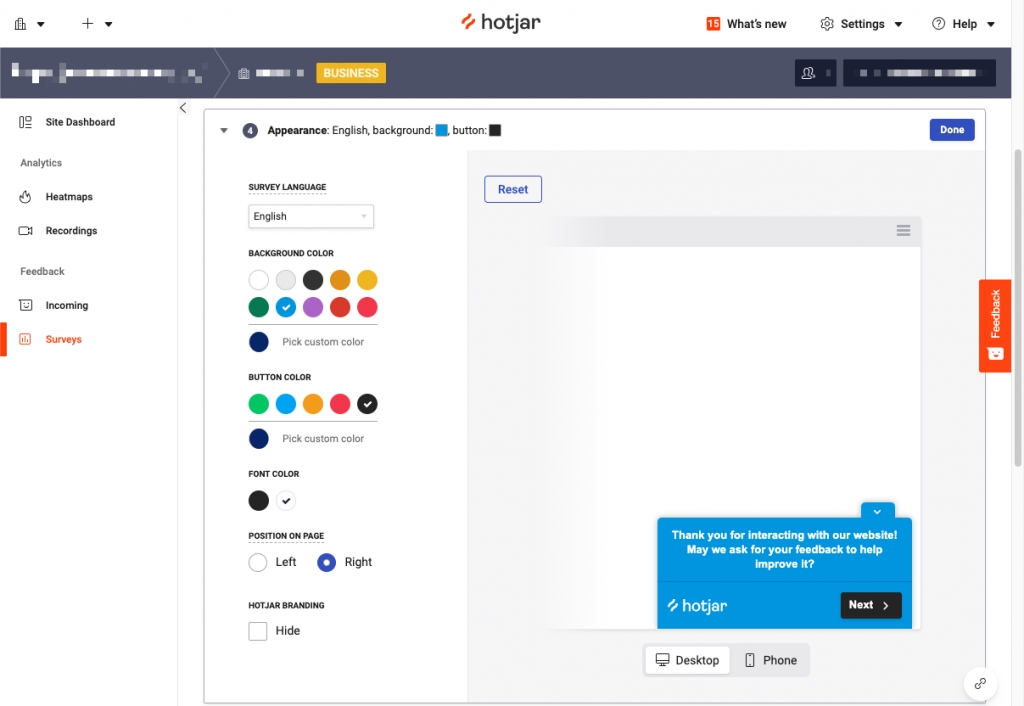
Also, customizing a survey with your brand colors and messaging is easy. We made sure to include copy in this popover survey that would be appreciative and approachable the exact moment a visitor on a page exhibited rage click tendencies:
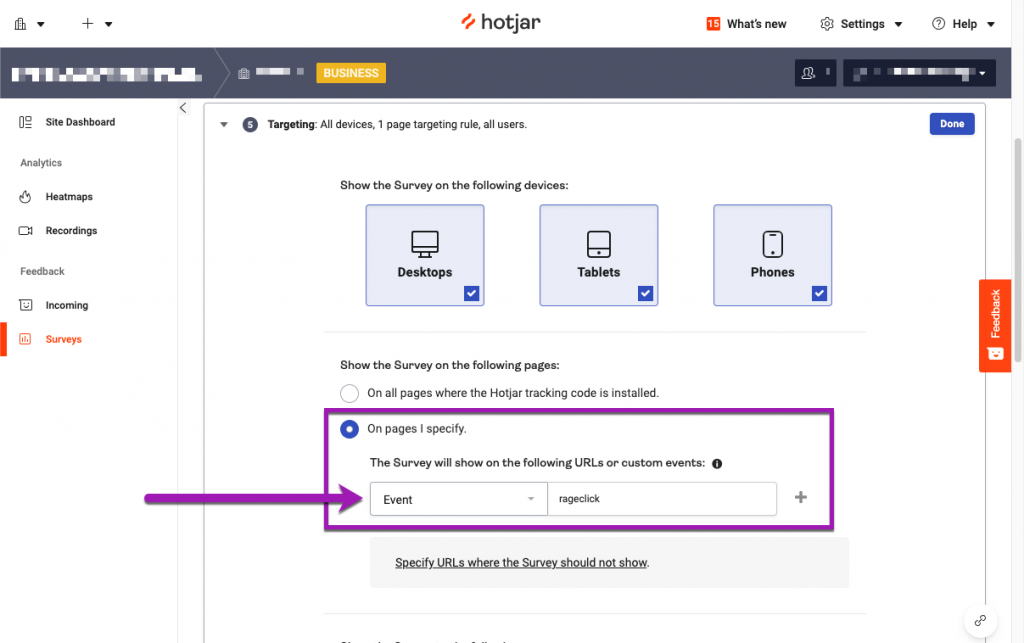
In order to create a survey that will appear upon a rage click, you should specify that it will appear at the moment the custom event is triggered in GTM, as seen below:
Make sure all of your settings are up to your needs, set the survey to Active, and save your changes. Your new Hotjar popover survey will be live on your site for your visitors to fill out in the event they want to provide feedback.
What Will I Gain From This Robust Setup?
Setting up this rage click tracking ecosystem will provide invaluable insights and feedback into where your website visitors and customers find points of frustration in their journey:
- Discover needed design changes that may have gone unnoticed in production.
- Uncover opportunities for conversion rate optimization.
- Spotlight areas to improve metrics like core web vitals.
- Provide evidence of pages and elements that need UX improvements.
Let’s Recap
Rage clicks are a kind of user behavior that shouldn’t go unnoticed on your websites. By setting up a robust tracking process like the one we’ve provided, you can also earn insights, feedback, and learnings to improve your pages’ user experience, customer journey, and conversion rates. Other contributors and stakeholders in your business will value rage click tracking in order to optimize toward business goals and customer satisfaction.


This is helpful! Is there a step by step version for Microsoft Clarity instead of Hotjar?
Hi, Keith! Thank you so much for your feedback and question. We’re exploring Microsoft Clarity and other behavior analytics tools and how they can best integrate with reporting and provide invaluable insights.
Stay tuned, and we hope to share some of our discoveries in future posts!