
We know that content on your website is important. It should communicate value to your visitors, adhere to Google’s standards so that it can be crawled, and rank well in the SERP. Your content is the main driving force of conversions and ultimately affects your company’s bottom line.
Is it possible that the readability of your website can impact your conversion rates? I approached one of our conversion rate optimization strategists, Whitney Norton, with this question to see what she thought.
Our hypothesis was yes, but we didn’t know to what extent. To test our theory, we used anonymized client data to evaluate the “readability” of client websites and correlated them against conversion rates. In this post, we’ll share what we found. If you’d like to nerd-out with us over stats and analysis, read on! If you’d just like actionable next steps, feel free to jump to our “Final Thoughts” at the end.
Methodology
For this study, we measured and compared two factors: a website’s readability and its conversion rate. We had a sample size of 33 client websites.
Readability
Using a website readability analyzer, we crawled individual websites to get a readability metric called the “Flesch Reading Ease” score. Scores are calculated based on an equation that measures the total number of words, the total number of sentences, and the total number of syllables. This score is determined on a scale of 0 to 100, where lower scores are more difficult to read, and higher scores are easier to read. More importantly, this means your content uses plain English. Ideally, a website score would rank between 60 and 90, which equates to a grade level between 6th and 8th grades.
Here is a breakdown of scores and how they associate with grade levels:
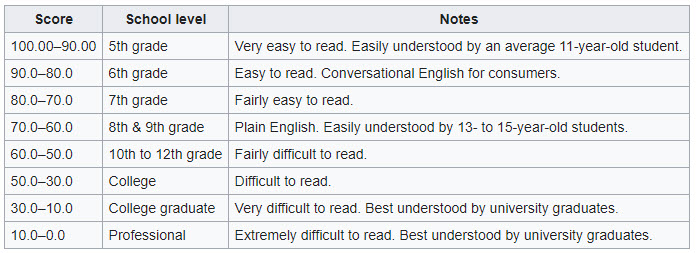
You’ll also notice here that as grade levels go UP, Scores go DOWN. While they aim to measure a similar phenomenon, the score and school level have an inverse relationship. For example, here is the Portent website Flesch reading score:
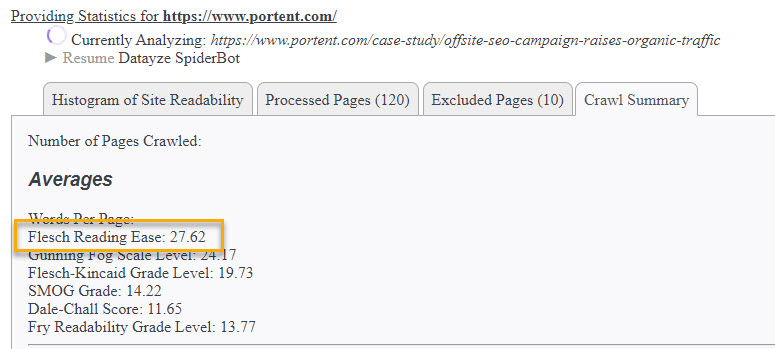
(But wait, that score looks low – isn’t the goal between 60-90? More on this later.)
Conversion Rate
We pulled an annual average for either the primary conversion rate percentage or the e-commerce conversion rate percentage, depending on the client. For e-commerce clients, it was a purchase. For B2B clients, it was often a form submission to contact a sales team. These conversion metrics represent the main, highest-impact activity on a website. To account for the impacts of the Coronavirus on some clients, we looked at the average rate between March 2019 and March 2020 for them.
Our Process
Using the anonymized client data, we plotted the conversion rate against the Flesch Reading Ease score in a scatterplot.
We included data from domains where the entire site could be measured for both the conversion rate and the reading score, and excluded websites that were fewer than five pages where the primary intention was to be a set of landing pages for paid search ads.
The Results
When we plotted conversion rate (our dependent variable) against readability score (our independent variable), there was a positive correlation between them. However, it was not strong enough to indicate readability as a singular determining factor of whether users converted or not.
For all sites, our R² score, or “coefficient of determination,” was 0.114. This means that approximately 11% of the conversion rate is dependent on the readability score. So while it is not a majority factor based on our data, it is still a correlated factor.

E-commerce Findings
When filtering for e-commerce clients only, there was a slightly stronger correlation with an R² score of 0.131. This means that for B2C clients, around 13% of the conversion rate is dependent on the site’s readability score.

Why would these conversion rates experience a higher correlation to the reading score?
We believe it is because e-commerce purchases have faster sales cycles, and likely need to spend less time establishing and communicating expertise with their content. For example, buying clothing or booking an auto service is a lower barrier than purchasing an enterprise-level software solution.
Consumer products are also usually less costly than enterprise-level B2B products and solutions. With direct-to-consumer products at lower price points, less content needs to be written to communicate product or service value, since these are often lower-stakes purchases.
Faster decisions, lower barriers to entry, and lower-stakes purchases likely mean that users give these pages more cursory reads than their B2B counterparts. With less attention paid, readability had a greater impact on conversion rate.
B2B Findings
For B2B sites, we see a very different story with readability and conversion rates. While the overall data and e-commerce results specifically show a positive correlation between the two variables, B2B delivered an insignificant relationship between readability and conversion rates. In fact, it looks like they aren’t correlated at all:

We see a wide range of average reading scores (most fell somewhere between 20-60), and conversion rates are anywhere between <1% – 3%. I’ll also point out again here that our sample size is low. With a larger sample size, we may see a stronger correlation one way or another.
Important to note is that B2B readability scores are lower than e-commerce sites. On average, this may not be a problem. It speaks to a different side of user behavior, and the way B2B websites are used to communicate value. Typically, B2B products and services have longer lead times and are more costly. As a result, these companies need to create content that continues to communicate value and justify a more expensive purchase. Depending on the product or service, the concepts may be very sophisticated and require a higher level of comprehension to communicate that value.
As we saw earlier, the Portent.com website has an average readability score of approximately 28. As a B2B business, this may not be a nail in the coffin.
Communicating expertise and highly technical resources are likely associated with longer sentence structures and more keywords per sentence, resulting in a lower reading score, and a higher grade level score.
As a B2B business, it’s important to communicate your value at a readability score that matches the level of your audience.
Other Findings
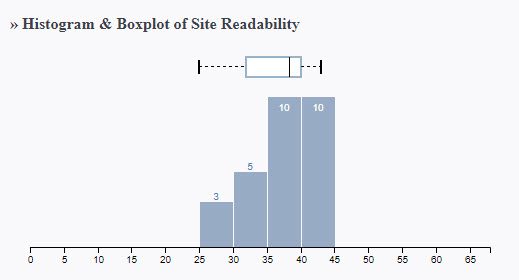
We also found that the distribution of reading scores by page was not always a normal distribution. For example, the Portent website distribution of reading score by page looked like this:

Based on this chart, we can see that a large number of pages fall into the 0-10 category, but the remaining pages on the website follow more of a “normal” distribution. Portent’s site features some highly technical resources, but the rest of the site features more readable content.
Here are some additional examples of readability score distributions by page:


These variations indicate that it’s okay for the readability score to change from page to page, depending on the purpose of the page. What may matter more are your entry and conversion pages, and the readability of those.
If We Could Do This Study Again, What Would We Do Differently?
Larger sample size. This was one of our biggest limitations of the study. With our sample size limited based on client data availability, we can make broad assumptions, but not concrete proclamations about the effect of readability and conversion rates. We are confident in the variety of clients and industries we evaluated to know that our data is not pigeon-holed into too narrow of a focus, but ideally, we would be able to evaluate a larger number of websites.
Final Thoughts
Is readability the primary factor in your conversion rates? No. Should you still pay attention to it? Yes. Even in our limited study, it accounted for as much as 13% of conversion, and that’s no small thing.
How to Get Started
When evaluating your own website’s readability, we recommend starting with a tool like Datayze to get an understanding of your site overall. If your site’s average score falls below 60, you have some work to do. To maximize your impact, start with your site’s entry points (like your home and landing pages) and conversion pages. Whenever possible, reserve highly-technical content for resource pages.
For best practices on writing more readable content, check out the tips that Brittney Urich, now a UX Designer at Amazon, gave at one of our favorite Seattle Interactive Conference sessions last month. Most importantly, she says to write for your audience and to use plain language. Her favorite resource is the Federal Guide for Using Plain Language.
Of course, if you need help, we’d love to hear from you. After all, we’re a team of nerds who spent considerable time conducting a study of how readability relates to conversion rate. We love this stuff.


