
I celebrated my eighth anniversary at Portent earlier this month. A couple of us reminisced about my job interview that was held in a server storage closet. We’ve come a long way since then, and my role here has changed quite a bit as well.
Something that hasn’t changed is my ability to dive into Google Analytics, dig around, understand the numbers, and derive actionable next steps for strategy and tactics. I learned how to do that early on in my career here, and the skill set has stuck ever since.
In my opinion, the ability to do so is the most foundational technical skill that a digital marketer can hold, and making sure I stay agile in GA is one of the reasons I still work day-to-day with a long-time client of ours.
If you’re not jumping into your data regularly to pull insights and build actionable next steps, it’s time to level up. With a properly configured GA property, all of this information is free, and the ability to use it appropriately can provide you with insights to help your organization make monumental KPI improvements.
The following GA reports are well-known and well-used (I hope). I consider these top-level reports:
- Acquisition – All Traffic – Channels
- Acquisition – All Traffic – Source/Medium
- Acquisition – Google Ads – Campaigns
- Acquisition – Search Console – Landing Pages
- Behavior – Overview
- Conversions – Goals – Overview
- Conversions – Ecommerce – Overview
If you’re diving into those reports on a regular basis, that’s a solid start. But when you’re ready to dig a little deeper, here’s where you should go next.
Quick note: none of these reports utilize custom or user-defined variables. And while using custom variables is great, this post focuses on what’s already provided in GA out of the box. Every report outlined below is available in standard Google Analytics property Analytics.
1. Audience – Geo – Location
Find Acquisition, Behavior, and Conversion metrics broken down by location.

Quickly view metrics by country, state, and city to see where performance soars and struggles. Consider how to adjust your budget, strategy, and tactics based on regional performance.
2. Audience – Technology – Browser & OS
This report shares Acquisition, Behavior, and Conversion metrics across several technology-related primary dimensions.
Discover performance broken down by browser type, operating system used, and screen size. It’s amazing how much performance can vary across these dimensions.
Pulling insights here can be impactful when it comes time to address strategy around design and development. Yes, data should be considered when website design and development decisions are made; here’s one place to get that data.
3. Audience – Mobile – Overview
This tab isn’t just for mobile-traffic learning. Find Acquisition, Behavior, and Conversion metrics broken down by device category.
See how traffic performs differently from users using a desktop, mobile device, or tablet. Consideration around which device types are most commonly accessing your site should fuel strategy for your next campaign or initiative.

This information can be incredibly valuable when designing and optimizing PPC campaigns or planning your next website redesign.
4. Acquisition – Google Ads – Search Queries
This tab will only be useful for marketers utilizing Google Ads and those who have their account linked to their Google Analytics property.
Discover which queries users are searching for to trigger impressions and clicks of your paid ad.
Acquisition, Behavior, and Conversion insights here should inform your paid search strategy, but can also influence SEO direction.
5. Acquisition – Google Ads – Hour of Day
Discover Google Ads performance broken down by the hour of the day and the day of the week that your campaigns run.
Based on insights dug up here, build custom ad schedules in your campaigns to boost spending when performance is best and pull back your budget to save money during low conversion periods.
6. Behavior – Site Content – Exit Pages
Identify which pages most commonly result in a user leaving your site.
Information here might highlight critical pages in your conversion funnel. If exit rates are high on conversion path pages, think about how the content and layout of that page should change to create a more frictionless experience to conversion.

7. Behavior – Site Speed – Page Timings
Locate pages with slow load times.
This report will compare individual pages on your site to your site’s average page load time. While it’s not the best report to provide you with overall site speed performance, it can help highlight the most important pages that are lagging behind your site’s average load time.
Site speed and page load time are core factors to Google’s algorithm and studies have time and time again shown that a faster site leads to higher conversion rates.
8. Conversions – Multi-Channel Funnels – Top Conversion Paths
Discover the touchpoints needed by a single user along the path to conversion.
This report breaks down source and medium pathing to provide a story of how multiple touchpoints and visits influence a conversion on your site.
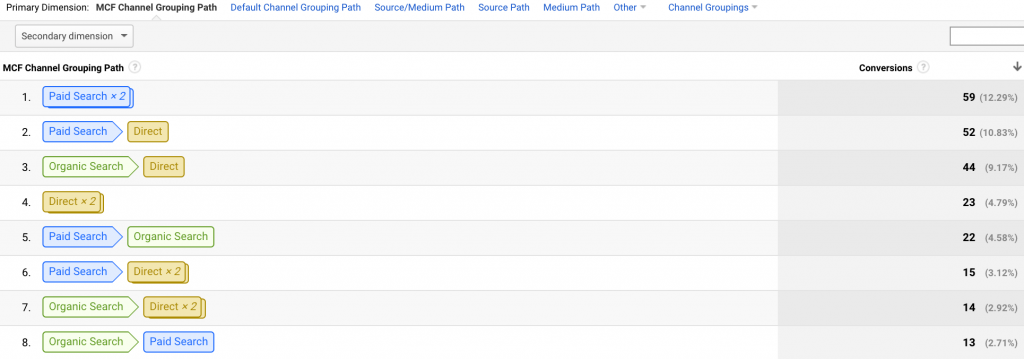
If you’re aligned in using an appropriate attribution model for your business, this report is a must.
Leverage Automation to Help
Automation and shortcut building is a great way to save time, but do not rely on automation to roll all of your data aggregation up for you. I guarantee you will miss something if you never dive into the numbers on your own and do some digging.
That said, consolidate and automate to help highlight performance highs and lows. Creating a custom dashboard in Google Analytics or Google Data Studio is a great place to start. Google Analytics has an automated alert capability that can be leveraged as well. Feed those alerts into Slack or straight to your inbox to further ease the burden of digging into the data every day.
Use automation to notify you of issues. Don’t rely on it to do everything for you.
As you go through your detective work in GA and set up automated reports and alerts to aid your efforts, be mindful of the parameters that your data comes with. These parameters become incredibly important to make sure that time comparisons (YoY, MoM, etc.) are valid. Ask yourself questions, such as:
- Is your data reliable and free of tracking errors?
- Have goals and conversion points changed?
- Do you need to account for seasonality?
When marketers are mindful of the questions above, armed with the know-how to gather insights, and have the desire to do a little detective work, the potential insights found can be substantial.


Hi Chad! – this is an excellent & concise list of angles of analysis via GA that one might not be aware of, or aware of but perhaps tucked away in a brain file cabinet that needs dusting off. I recommended this to my colleagues to read. Thanks!
Hey David! There certainly is not much groundbreaking information in this post but you’re exactly right, getting back-to-basics with a few reminders around commonly overlooked data isn’t a bad thing.
Great to hear from you- hope all is well!