This series was originally written by Ian Lurie in 2015 and updated by Chad Kearns in 2020.
In Part 2, I talked about infrastructure and its place in the Marketing Stack. In this post, I talk about analytics and its role in internet marketing.
Part 1: The Digital Marketing Stack
Part 2: Infrastructure
Part 3: Analytics ← You are here
Part 4: Content
Part 5: The Channels – Paid, Earned, and Owned
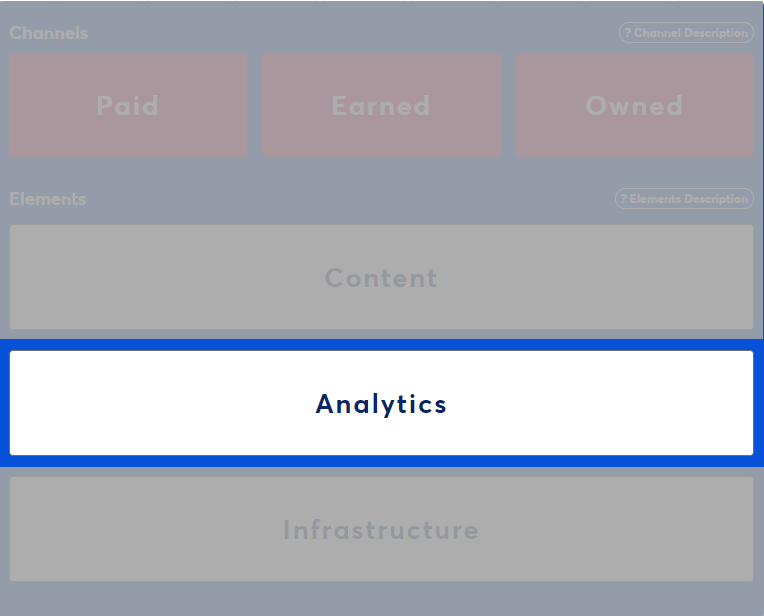
Analytics measures the effectiveness of your infrastructure, your audience’s response to content, and your channel performance.
If you don‘t measure, you can‘t observe. If you don‘t observe, it becomes awfully hard to adjust your tactics effectively. That leaves you hoping that your messages, offerings, and calls-to-action are resonating.

Analytics doesn’t have to be hard and, if done correctly, should be an instrumental tool used every day.
It Starts With Goals
You need context to help interpret the data you collect.
Raw numbers are great, but if you don’t have anything to compare against, your numbers are all relative.
Start with the most important metric for your business.
For most, that’s going to land at revenue or a revenue-efficiency metric like gross profit. For some, and depending on the kind of work you are accountable for, other top-level goals could center around users acquired or leads submitted.
Once you’ve identified the metrics most important to your objectives, make sure your goals are clear, measurable, and have a timeline attached.
The Tools
Pick your tools based on the goals you‘re trying to measure. Never lose sight of the goals! Otherwise, you’ll waste time and money. Typically, though, you’ll need:
- A web analytics tool. Google Analytics is the go-to, but there are lots of others. Regardless of what you pick, use it consistently.
- Offsite data. Social shares, comments, reviews, sentiment, and any other information about user behavior when they‘re not on your site. At a minimum, use a tool like SharedCount. Buzzsumo is a nice choice, too.
- Excel or greater. No matter how good the toolset, you‘ll need to crunch numbers. Excel is my starting point. Fancier tools include R, any SQL-driven database, or pre-built toolsets like Tableau.
What to Measure
With tools in hand and goals in mind, you need to measure progress. The only kind of measurement that matters is progress towards the goals. Everything you measure must somehow connect back to your goals.
Which metrics most directly measure progress towards your goal?
By default, Google Analytics does a nice job of breaking down measurement metrics into three categories- acquisition, behavior, conversion.
Acquisition
Acquisition metrics focus on how people get to your site.
Do they come directly, through paid media, from organic listings, or via referrals? What devices are they using, and how does the device type affect performance? How does visitor performance vary by physical location or primary language?
Break down that data to learn what channels and sources are driving your most important traffic. Discover how to prioritize your site functionality based on visitors using mobile devices, tablets, or desktops.
Understanding how visitors access your site enables you to test and tweak your channel mix to optimize performance.
Behavior
Once on your site, how do users interact with it?
See which content resonates and what doesn’t. Find site speed reports to boost conversion rates and review what users are searching for in your site search to ideate new ideas for content.
Understanding how visitors behave on your site enables you to test and tweak your on-site content to optimize performance.
Conversions
Your most important conversion metrics should be the ones with the closest connection to your top-level goals.
Leads submitted, products purchased, and how those visitors reached your conversion point are found here. Building on that, understanding how to leverage proper attribution modeling will help take your analytics work to the next level.
Knowing how visitors convert on your site enables you to test and tweak your conversion funnel to optimize performance.
Offsite Data
Your data analytics practice shouldn’t start and stop with what’s available through your web analytics tracking tool. Offsite and offline data can be effectively used to further provide context to how your marketing efforts are performing.
Here are a few sources to think about that don’t come built out of the box with web tracking analytics solutions:
- Phone calls received
- In-store foot traffic and sales generated
- Lead closure rates (closed-loop analytics, anyone?)
Decide. Measure. Adjust.
The list of metrics you can track is long and arduous. Simplify things and start with the core business goals and go from there.
Assemble your tools, start tracking, and use the data to drive your marketing further.
Utilizing the data available makes it easy to find out what is going on. But those numbers can also give light to why your digital performance is thriving or falling behind; discovering the ‘why’ is a powerful thing for marketers to have.
Note: Read a bit more about analytics and compare it to other parts of the Stack in our Marketing Stack Explorer.
Part 1: The Digital Marketing Stack
Part 2: Infrastructure
Part 3: Analytics ← You are here
Part 4: Content
Part 5: The Channels – Paid, Earned, and Owned


